Page 197 - Computational Statistics Handbook with MATLAB
P. 197

184                        Computational Statistics Handbook with MATLAB


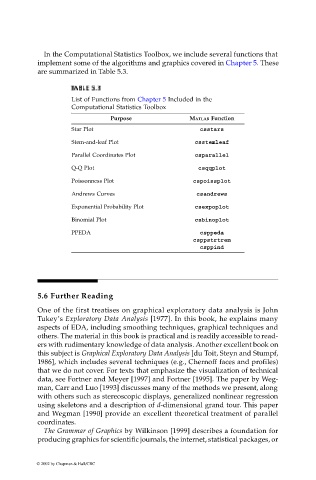
                              In the Computational Statistics Toolbox, we include several functions that
                             implement some of the algorithms and graphics covered in Chapter 5. These
                             are summarized in Table 5.3.


                                      T
                                       A
                                       A
                                      TA AB  BL LE L E 5.3 5.3
                                      T
                                      T
                                          E
                                            5.3
                                            5.3
                                          E
                                        B
                                        B
                                         L
                                      List of Functions from Chapter 5 Included in the
                                      Computational Statistics Toolbox
                                                 Purpose               MATLAB Function
                                      Star Plot                           csstars
                                      Stem-and-leaf Plot                csstemleaf
                                      Parallel Coordinates Plot         csparallel
                                      Q-Q Plot                           csqqplot
                                      Poissonness Plot                  cspoissplot
                                      Andrews Curves                     csandrews
                                      Exponential Probability Plot      csexpoplot
                                      Binomial Plot                     csbinoplot
                                      PPEDA                               csppeda
                                                                        csppstrtrem
                                                                          csppind


                             5.6 Further Reading
                             One of the first treatises on graphical exploratory data analysis is John
                             Tukey’s Exploratory Data Analysis [1977]. In this book, he explains many
                             aspects of EDA, including smoothing techniques, graphical techniques and
                             others. The material in this book is practical and is readily accessible to read-
                             ers with rudimentary knowledge of data analysis. Another excellent book on
                             this subject is Graphical Exploratory Data Analysis [du Toit, Steyn and Stumpf,
                             1986], which includes several techniques (e.g., Chernoff faces and profiles)
                             that we do not cover. For texts that emphasize the visualization of technical
                             data, see Fortner and Meyer [1997] and Fortner [1995]. The paper by Weg-
                             man, Carr and Luo [1993] discusses many of the methods we present, along
                             with others such as stereoscopic displays, generalized nonlinear regression
                             using skeletons and a description of d-dimensional grand tour. This paper
                             and Wegman [1990] provide an excellent theoretical treatment of parallel
                             coordinates.
                              The Grammar of Graphics by Wilkinson [1999] describes a foundation for
                             producing graphics for scientific journals, the internet, statistical packages, or


                            © 2002 by Chapman & Hall/CRC
   192   193   194   195   196   197   198   199   200   201   202