
Page 136 - Control Theory in Biomedical Engineering
P. 136
Genetic fuzzy logic based system for arrhythmia classification 121
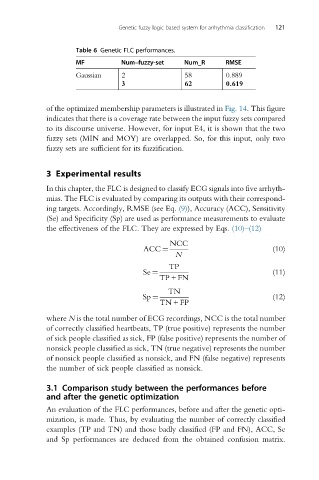
Table 6 Genetic FLC performances.
MF Num–fuzzy-set Num_R RMSE
Gaussian 2 58 0.889
3 62 0.619
of the optimized membership parameters is illustrated in Fig. 14. This figure
indicates that there is a coverage rate between the input fuzzy sets compared
to its discourse universe. However, for input E4, it is shown that the two
fuzzy sets (MIN and MOY) are overlapped. So, for this input, only two
fuzzy sets are sufficient for its fuzzification.
3 Experimental results
In this chapter, the FLC is designed to classify ECG signals into five arrhyth-
mias. The FLC is evaluated by comparing its outputs with their correspond-
ing targets. Accordingly, RMSE (see Eq. (9)), Accuracy (ACC), Sensitivity
(Se) and Specificity (Sp) are used as performance measurements to evaluate
the effectiveness of the FLC. They are expressed by Eqs. (10)–(12)
NCC
ACC ¼ (10)
N
TP
Se ¼ (11)
TP + FN
TN
Sp ¼ (12)
TN + FP
where N is the total number of ECG recordings, NCC is the total number
of correctly classified heartbeats, TP (true positive) represents the number
of sick people classified as sick, FP (false positive) represents the number of
nonsick people classified as sick, TN (true negative) represents the number
of nonsick people classified as nonsick, and FN (false negative) represents
the number of sick people classified as nonsick.
3.1 Comparison study between the performances before
and after the genetic optimization
An evaluation of the FLC performances, before and after the genetic opti-
mization, is made. Thus, by evaluating the number of correctly classified
examples (TP and TN) and those badly classified (FP and FN), ACC, Se
and Sp performances are deduced from the obtained confusion matrix.