
Page 396 - Corrosion Engineering Principles and Practice
P. 396
364 C h a p t e r 9 A t m o s p h e r i c C o r r o s i o n 365
Snow belt
Extremely
Severe
Severe
Moderate
Mild
Negligible
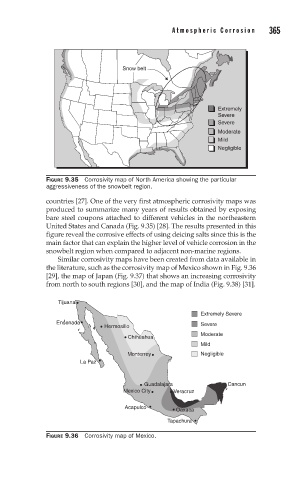
FIGURE 9.35 Corrosivity map of North America showing the particular
aggressiveness of the snowbelt region.
countries [27]. One of the very first atmospheric corrosivity maps was
produced to summarize many years of results obtained by exposing
bare steel coupons attached to different vehicles in the northeastern
United States and Canada (Fig. 9.35) [28]. The results presented in this
figure reveal the corrosive effects of using deicing salts since this is the
main factor that can explain the higher level of vehicle corrosion in the
snowbelt region when compared to adjacent non-marine regions.
Similar corrosivity maps have been created from data available in
the literature, such as the corrosivity map of Mexico shown in Fig. 9.36
[29], the map of Japan (Fig. 9.37) that shows an increasing corrosivity
from north to south regions [30], and the map of India (Fig. 9.38) [31].
Tijuana
Extremely Severe
Ensenada
Hermosillo Severe
Moderate
Chihuahua
Mild
Monterrey Negligible
La Paz
Guadalajara Cancun
Mexico City Veracruz
Acapulco
Oaxaca
Tapachura
FIGURE 9.36 Corrosivity map of Mexico.