
Page 393 - Corrosion Engineering Principles and Practice
P. 393
362 C h a p t e r 9 A t m o s p h e r i c C o r r o s i o n 363
9.5.2 ISO Classification of Corrosivity of Atmospheres
The International Organization for Standardization (ISO) has implemented
a worldwide atmospheric exposure program known as ISO CORRAG.
This program included exposure of steel, copper, zinc, and aluminum for
one, two, four, and eight years at 51 sites located in 14 nations in order to
generate the necessary data to produce a classification system for predicting
atmospheric corrosivity from commonly available weather data [25].
Triplicate specimens were used for each exposure. The metals selected
were a low carbon steel from a single supplier and commercially pure
zinc, copper, and aluminum. These nonferrous metals were obtained
from local sources in each of the participating nations. The program was
initiated in 1986 and closed in 1998. After a planned exposure, each
specimen was sent to the laboratory that had done the initial weighing for
cleaning and evaluation.
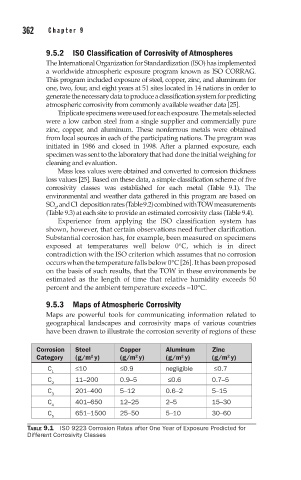
Mass loss values were obtained and converted to corrosion thickness
loss values [25]. Based on these data, a simple classification scheme of five
corrosivity classes was established for each metal (Table 9.1). The
environmental and weather data gathered in this program are based on
SO , and Cl deposition rates (Table 9.2) combined with TOW measurements
−
2
(Table 9.3) at each site to provide an estimated corrosivity class (Table 9.4).
Experience from applying the ISO classification system has
shown, however, that certain observations need further clarification.
Substantial corrosion has, for example, been measured on specimens
exposed at temperatures well below 0°C, which is in direct
contradiction with the ISO criterion which assumes that no corrosion
occurs when the temperature falls below 0°C [26]. It has been proposed
on the basis of such results, that the TOW in these environments be
estimated as the length of time that relative humidity exceeds 50
percent and the ambient temperature exceeds –10°C.
9.5.3 Maps of Atmospheric Corrosivity
Maps are powerful tools for communicating information related to
geographical landscapes and corrosivity maps of various countries
have been drawn to illustrate the corrosion severity of regions of these
Corrosion Steel Copper Aluminum Zinc
Category (g/m y) (g/m y) (g/m y) (g/m y)
2
2
2
2
C ≤10 ≤0.9 negligible ≤0.7
1
C 11–200 0.9–5 ≤0.6 0.7–5
2
C 201–400 5–12 0.6–2 5–15
3
C 401–650 12–25 2–5 15–30
4
C 651–1500 25–50 5–10 30–60
5
TABLE 9.1 ISO 9223 Corrosion Rates after One Year of Exposure Predicted for
Different Corrosivity Classes