Page 388 - Corrosion Engineering Principles and Practice
P. 388

356   C h a p t e r   9                              A t m o s p h e r i c   C o r r o s i o n    357


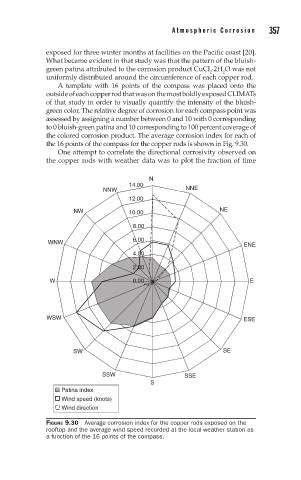
                      exposed for three winter months at facilities on the Pacific coast [20].
                      What became evident in that study was that the pattern of the bluish-
                                                                   .
                      green patina attributed to the corrosion product CuCl 2H O was not
                                                                       2
                                                                   2
                      uniformly distributed around the circumference of each copper rod.
                         A  template  with  16  points  of  the  compass  was  placed  onto  the
                      outside of each copper rod that was on the most boldly exposed CLIMATs
                      of that study in order to visually quantify the intensity of the bluish-
                      green color. The relative degree of corrosion for each compass point was
                      assessed by assigning a number between 0 and 10 with 0 corresponding
                      to 0 bluish-green patina and 10 corresponding to 100 percent coverage of
                      the colored corrosion product. The average corrosion index for each of
                      the 16 points of the compass for the copper rods is shown in Fig. 9.30.
                         One attempt to correlate the directional corrosivity observed on
                      the copper rods with weather data was to plot the fraction of time

                                                  N
                                             14.00
                                      NNW                   NNE
                                             12.00

                              NW             10.00                    NE
                                              8.00

                      WNW                     6.00                          ENE
                                              4.00
                                              2.00

                       W                      0.00                            E


                      WSW                                                   ESE


                             SW                                        SE


                                     SSW                    SSE
                                                   S
                          Patina index
                          Wind speed (knots)
                          Wind direction

                      FIGURE 9.30  Average corrosion index for the copper rods exposed on the
                      rooftop and the average wind speed recorded at the local weather station as
                      a function of the 16 points of the compass.
   383   384   385   386   387   388   389   390   391   392   393