Page 692 - Discrete Mathematics and Its Applications
P. 692

10.3 Representing Graphs and Graph Isomorphism  671


                                                     in the matrix. This entry is 1 if the graph contains this edge and is 0 otherwise. Consequently,
                                                     we need make only one comparison, namely, comparing this entry with 0, to determine whether
                                                     this edge is present. On the other hand, when we use adjacency lists to represent the graph, we
                                                     need to search the list of vertices adjacent to either v i or v j to determine whether this edge is
                                                     present. This can require  (|V |) comparisons when many edges are present.


                                                     Incidence Matrices

                                                    Another common way to represent graphs is to use incidence matrices. Let G = (V, E) be an
                                                     undirected graph. Suppose that v 1 , v 2 ,..., v n are the vertices and e 1 ,e 2 ,...,e m are the edges
                                                     of G. Then the incidence matrix with respect to this ordering of V and E is the n × m matrix
                                                     M =[m ij ], where

                                                               1   when edge e j is incident with v i ,
                                                        m ij =
                                                               0   otherwise.

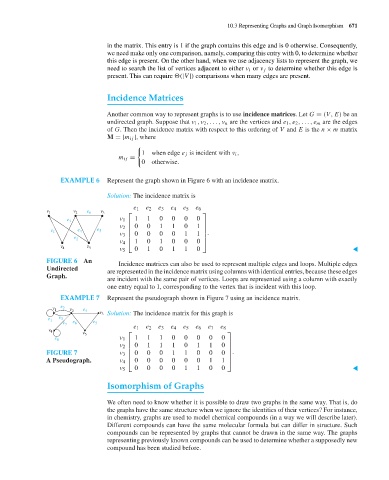
                                      EXAMPLE 6      Represent the graph shown in Figure 6 with an incidence matrix.

                                                     Solution: The incidence matrix is

                                                             e 1  e 2  e 3  e 4  e 5  e 6
                                 v 1      v 2  e 6  v 3
                                                           ⎡                       ⎤
                                        e 3              v 1  1  1   0   0   0   0
                                                           ⎢
                                                         v 2  ⎢ 0  0  1  1   0     ⎥
                                   e 1     e 4   e 5                             1 ⎥
                                                         v 3  ⎢  0  0  0  0  1   1  ⎥ .
                                          e 2              ⎢                       ⎥
                                                         v 4  ⎣  1  0  1  0  0   0  ⎦
                                      v 4     v 5
                                                         v 5  0  1   0   1   1   0                                                  ▲
                                 FIGURE 6 An
                                                        Incidence matrices can also be used to represent multiple edges and loops. Multiple edges
                                 Undirected
                                                     are represented in the incidence matrix using columns with identical entries, because these edges
                                 Graph.
                                                     are incident with the same pair of vertices. Loops are represented using a column with exactly
                                                     one entry equal to 1, corresponding to the vertex that is incident with this loop.
                                      EXAMPLE 7      Represent the pseudograph shown in Figure 7 using an incidence matrix.
                                   v 1  e 2  v 2  e 4  v
                                  e 1  e 3         3  Solution: The incidence matrix for this graph is
                                       e 7  e 6  e 5
                                  v 4        v             ⎡  e 1  e 2  e 3  e 4  e 5  e 6  e 7  e 8  ⎤
                                    e 8       5          v 1  1  1   1   0   0   0   0   0
                                                           ⎢
                                                                                          ⎥
                                                         v 2  ⎢ 0  1  1  1   0   1   1   0 ⎥
                                 FIGURE 7                v 3  ⎢  0  0  0  1  1   0   0   0  ⎥ .
                                                           ⎢                              ⎥
                                 A Pseudograph.          v 4  ⎣  0  0  0  0  0   0   1   1  ⎦
                                                         v 5  0  0   0   0   1   1   0   0                                          ▲
                                                     Isomorphism of Graphs


                                                     We often need to know whether it is possible to draw two graphs in the same way. That is, do
                                                     the graphs have the same structure when we ignore the identities of their vertices? For instance,
                                                     in chemistry, graphs are used to model chemical compounds (in a way we will describe later).
                                                     Different compounds can have the same molecular formula but can differ in structure. Such
                                                     compounds can be represented by graphs that cannot be drawn in the same way. The graphs
                                                     representing previously known compounds can be used to determine whether a supposedly new
                                                     compound has been studied before.
   687   688   689   690   691   692   693   694   695   696   697