
Page 344 - Data Architecture
P. 344
Chapter 9.1: Repetitive Analytics: Some Basics
Looking for Patterns
However, the analytic study is done; the study typically looks for patterns. Stated
differently, the organization identifies patterns that lead to conclusions. The patterns are
tip-offs that important previously unknown events are occurring. By knowing these
patterns, the organization can then have insights that allow the organization to manage
itself more efficiently or more safely or more economically or whatever the end goal of
the study is.
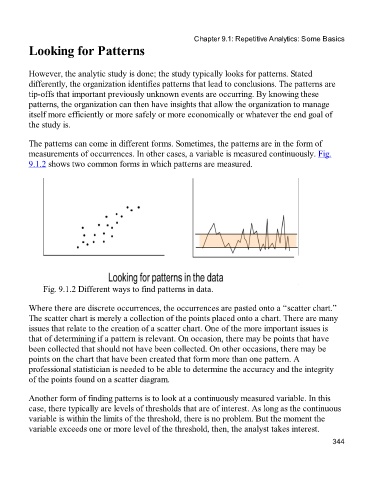
The patterns can come in different forms. Sometimes, the patterns are in the form of
measurements of occurrences. In other cases, a variable is measured continuously. Fig.
9.1.2 shows two common forms in which patterns are measured.
Fig. 9.1.2 Different ways to find patterns in data.
Where there are discrete occurrences, the occurrences are pasted onto a “scatter chart.”
The scatter chart is merely a collection of the points placed onto a chart. There are many
issues that relate to the creation of a scatter chart. One of the more important issues is
that of determining if a pattern is relevant. On occasion, there may be points that have
been collected that should not have been collected. On other occasions, there may be
points on the chart that have been created that form more than one pattern. A
professional statistician is needed to be able to determine the accuracy and the integrity
of the points found on a scatter diagram.
Another form of finding patterns is to look at a continuously measured variable. In this
case, there typically are levels of thresholds that are of interest. As long as the continuous
variable is within the limits of the threshold, there is no problem. But the moment the
variable exceeds one or more level of the threshold, then, the analyst takes interest.
344