
Page 345 - Data Architecture
P. 345
Chapter 9.1: Repetitive Analytics: Some Basics
Usually, the analysis centers around questions of what else has occurred when the
variable has exceeded the threshold value.
Once the points of events have been captured and fit to a graph, the next issue is that of
identifying false positives. A false positive is an event that has occurred but for reasons
unrelated to the study. If enough variables are studied, there will be occurrences of false
positives merely by the fact that enough variables have been correlated to each other.
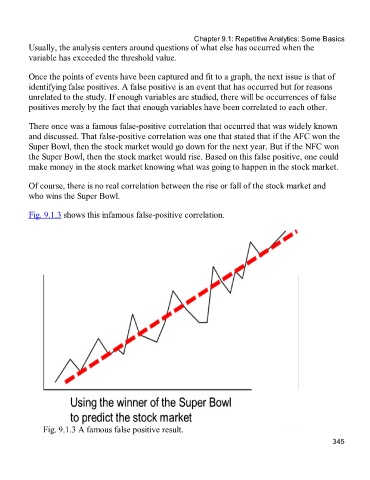
There once was a famous false-positive correlation that occurred that was widely known
and discussed. That false-positive correlation was one that stated that if the AFC won the
Super Bowl, then the stock market would go down for the next year. But if the NFC won
the Super Bowl, then the stock market would rise. Based on this false positive, one could
make money in the stock market knowing what was going to happen in the stock market.
Of course, there is no real correlation between the rise or fall of the stock market and
who wins the Super Bowl.
Fig. 9.1.3 shows this infamous false-positive correlation.
Fig. 9.1.3 A famous false positive result.
345