
Page 117 -
P. 117
HAN 09-ch02-039-082-9780123814791
80 Chapter 2 Getting to Know Your Data 2011/6/1 3:15 Page 80 #42
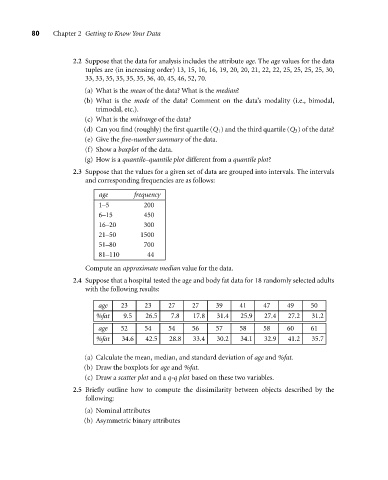
2.2 Suppose that the data for analysis includes the attribute age. The age values for the data
tuples are (in increasing order) 13, 15, 16, 16, 19, 20, 20, 21, 22, 22, 25, 25, 25, 25, 30,
33, 33, 35, 35, 35, 35, 36, 40, 45, 46, 52, 70.
(a) What is the mean of the data? What is the median?
(b) What is the mode of the data? Comment on the data’s modality (i.e., bimodal,
trimodal, etc.).
(c) What is the midrange of the data?
(d) Can you find (roughly) the first quartile (Q 1 ) and the third quartile (Q 3 ) of the data?
(e) Give the five-number summary of the data.
(f) Show a boxplot of the data.
(g) How is a quantile–quantile plot different from a quantile plot?
2.3 Suppose that the values for a given set of data are grouped into intervals. The intervals
and corresponding frequencies are as follows:
age frequency
1–5 200
6–15 450
16–20 300
21–50 1500
51–80 700
81–110 44
Compute an approximate median value for the data.
2.4 Suppose that a hospital tested the age and body fat data for 18 randomly selected adults
with the following results:
age 23 23 27 27 39 41 47 49 50
%fat 9.5 26.5 7.8 17.8 31.4 25.9 27.4 27.2 31.2
age 52 54 54 56 57 58 58 60 61
%fat 34.6 42.5 28.8 33.4 30.2 34.1 32.9 41.2 35.7
(a) Calculate the mean, median, and standard deviation of age and %fat.
(b) Draw the boxplots for age and %fat.
(c) Draw a scatter plot and a q-q plot based on these two variables.
2.5 Briefly outline how to compute the dissimilarity between objects described by the
following:
(a) Nominal attributes
(b) Asymmetric binary attributes