
Page 211 -
P. 211
11-ch04-125-186-9780123814791
HAN
2011/6/1
174 Chapter 4 Data Warehousing and Online Analytical Processing 3:17 Page 174 #50
values for each attribute and is smaller than |W|, the number of tuples in the work-
ing relation. Notice that it may not be necessary to scan the working relation once,
since if the working relation is large, a sample of such a relation will be sufficient to
get statistics and determine which attributes should be generalized to a certain high
level and which attributes should be removed. Moreover, such statistics may also be
obtained in the process of extracting and generating a working relation in Step 1.
Step 3 derives the prime relation, P. This is performed by scanning each tuple in
the working relation and inserting generalized tuples into P. There are a total of |W|
tuples in W and p tuples in P. For each tuple, t, in W, we substitute its attribute values
0
based on the derived mapping pairs. This results in a generalized tuple, t . If variation
0
(a) in Figure 4.18 is adopted, each t takes O(logp) to find the location for the count
increment or tuple insertion. Thus, the total time complexity is O(|W| × logp) for
0
all of the generalized tuples. If variation (b) is adopted, each t takes O(1) to find the
tuple for the count increment. Thus, the overall time complexity is O(N) for all of
the generalized tuples.
Many data analysis tasks need to examine a good number of dimensions or attributes.
This may involve dynamically introducing and testing additional attributes rather than
just those specified in the mining query. Moreover, a user with little knowledge of the
truly relevant data set may simply specify “in relevance to ∗” in the mining query, which
includes all of the attributes in the analysis. Therefore, an advanced–concept description
mining process needs to perform attribute relevance analysis on large sets of attributes
to select the most relevant ones. This analysis may employ correlation measures or tests
of statistical significance, as described in Chapter 3 on data preprocessing.
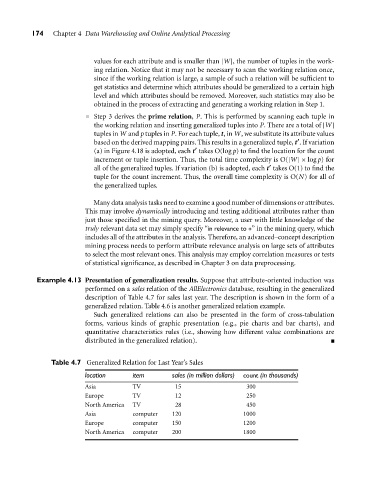
Example 4.13 Presentation of generalization results. Suppose that attribute-oriented induction was
performed on a sales relation of the AllElectronics database, resulting in the generalized
description of Table 4.7 for sales last year. The description is shown in the form of a
generalized relation. Table 4.6 is another generalized relation example.
Such generalized relations can also be presented in the form of cross-tabulation
forms, various kinds of graphic presentation (e.g., pie charts and bar charts), and
quantitative characteristics rules (i.e., showing how different value combinations are
distributed in the generalized relation).
Table 4.7 Generalized Relation for Last Year’s Sales
location item sales (in million dollars) count (in thousands)
Asia TV 15 300
Europe TV 12 250
North America TV 28 450
Asia computer 120 1000
Europe computer 150 1200
North America computer 200 1800