
Page 214 -
P. 214
3:17 Page 177
#53
2011/6/1
11-ch04-125-186-9780123814791
HAN
4.5 Data Generalization by Attribute-Oriented Induction 177
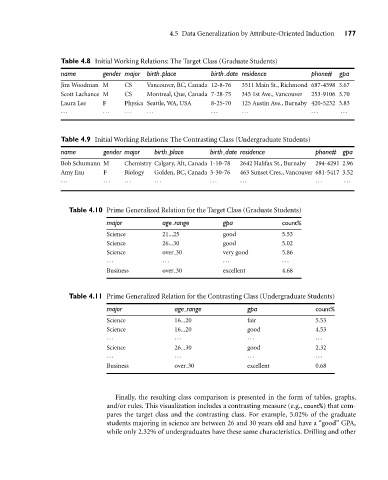
Table 4.8 Initial Working Relations: The Target Class (Graduate Students)
name gender major birth place birth date residence phone# gpa
Jim Woodman M CS Vancouver, BC, Canada 12-8-76 3511 Main St., Richmond 687-4598 3.67
Scott Lachance M CS Montreal, Que, Canada 7-28-75 345 1st Ave., Vancouver 253-9106 3.70
Laura Lee F Physics Seattle, WA, USA 8-25-70 125 Austin Ave., Burnaby 420-5232 3.83
··· ··· ··· ··· ··· ··· ··· ···
Table 4.9 Initial Working Relations: The Contrasting Class (Undergraduate Students)
name gender major birth place birth date residence phone# gpa
Bob Schumann M Chemistry Calgary, Alt, Canada 1-10-78 2642 Halifax St., Burnaby 294-4291 2.96
Amy Eau F Biology Golden, BC, Canada 3-30-76 463 Sunset Cres., Vancouver 681-5417 3.52
··· ··· ··· ··· ··· ··· ··· ···
Table 4.10 Prime Generalized Relation for the Target Class (Graduate Students)
major age range gpa count%
Science 21...25 good 5.53
Science 26...30 good 5.02
Science over 30 very good 5.86
··· ··· ··· ···
Business over 30 excellent 4.68
Table 4.11 Prime Generalized Relation for the Contrasting Class (Undergraduate Students)
major age range gpa count%
Science 16...20 fair 5.53
Science 16...20 good 4.53
··· ··· ··· ···
Science 26...30 good 2.32
··· ··· ··· ···
Business over 30 excellent 0.68
Finally, the resulting class comparison is presented in the form of tables, graphs,
and/or rules. This visualization includes a contrasting measure (e.g., count%) that com-
pares the target class and the contrasting class. For example, 5.02% of the graduate
students majoring in science are between 26 and 30 years old and have a “good” GPA,
while only 2.32% of undergraduates have these same characteristics. Drilling and other