
Page 269 -
P. 269
12-ch05-187-242-9780123814791
HAN
232 Chapter 5 Data Cube Technology 2011/6/1 3:19 Page 232 #46
Three measures are used as exception indicators to help identify data anomalies.
These measures indicate the degree of surprise that the quantity in a cell holds, with
respect to its expected value. The measures are computed and associated with every cell,
for all aggregation levels. They are as follows:
SelfExp: This indicates the degree of surprise of the cell value, relative to other cells
at the same aggregation level.
InExp: This indicates the degree of surprise somewhere beneath the cell, if we were
to drill down from it.
PathExp: This indicates the degree of surprise for each drill-down path from the cell.
The use of these measures for discovery-driven exploration of data cubes is illustrated
in Example 5.21.
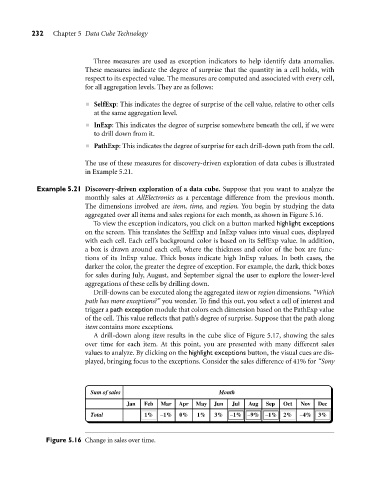
Example 5.21 Discovery-driven exploration of a data cube. Suppose that you want to analyze the
monthly sales at AllElectronics as a percentage difference from the previous month.
The dimensions involved are item, time, and region. You begin by studying the data
aggregated over all items and sales regions for each month, as shown in Figure 5.16.
To view the exception indicators, you click on a button marked highlight exceptions
on the screen. This translates the SelfExp and InExp values into visual cues, displayed
with each cell. Each cell’s background color is based on its SelfExp value. In addition,
a box is drawn around each cell, where the thickness and color of the box are func-
tions of its InExp value. Thick boxes indicate high InExp values. In both cases, the
darker the color, the greater the degree of exception. For example, the dark, thick boxes
for sales during July, August, and September signal the user to explore the lower-level
aggregations of these cells by drilling down.
Drill-downs can be executed along the aggregated item or region dimensions. “Which
path has more exceptions?” you wonder. To find this out, you select a cell of interest and
trigger a path exception module that colors each dimension based on the PathExp value
of the cell. This value reflects that path’s degree of surprise. Suppose that the path along
item contains more exceptions.
A drill-down along item results in the cube slice of Figure 5.17, showing the sales
over time for each item. At this point, you are presented with many different sales
values to analyze. By clicking on the highlight exceptions button, the visual cues are dis-
played, bringing focus to the exceptions. Consider the sales difference of 41% for “Sony
Sum of sales Month
Jan Feb Mar Apr May Jun Jul Aug Sep Oct Nov Dec
Total 1% −1% 0% 1% 3% −1% −9% −1% 2% −4% 3%
Figure 5.16 Change in sales over time.