
Page 270 -
P. 270
2011/6/1
12-ch05-187-242-9780123814791
HAN
#47
3:19 Page 233
5.4 Multidimensional Data Analysis in Cube Space 233
Avg. sales Month
Item Jan Feb Mar Apr May Jun Jul Aug Sep Oct Nov Dec
Sony b/w printer 9% −8% 2% −5% 14% −4% 0% 41% −13% −15% −11%
Sony color printer 0% 0% 3% 2% 4% −10% −13% 0% 4% −6% 4%
HP b/w printer −2% 1% 2% 3% 8% 0% −12% −9% 3% −3% 6%
HP color printer 0% 0% −2% 1% 0% −1% −7% −2% 1% −4% 1%
IBM desktop computer 1% −2% −1% −1% 3% 3% −10% 4% 1% −4% −1%
IBM laptop computer 0% 0% −1% 3% 4% 2% −10% −2% 0% −9% 3%
Toshiba desktop computer −2% −5% 1% 1% −1% 1% 5% −3% −5% −1% −1%
Toshiba laptop computer 1% 0% 3% 0% −2% −2% −5% 3% 2% −1% 0%
Logitech mouse 3% −2% −1% 0% 4% 6% −11% 2% 1% −4% 0%
Ergo-way mouse 0% 0% 2% 3% 1% −2% −2% −5% 0% −5% 8%
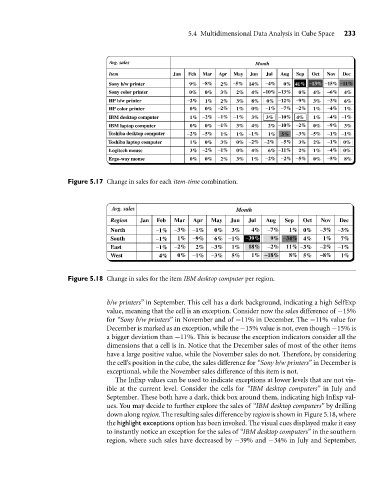
Figure 5.17 Change in sales for each item-time combination.
Avg. sales Month
Region Jan Feb Mar Apr May Jun Jul Aug Sep Oct Nov Dec
North −1% −3% −1% 0% 3% 4% −7% 1% 0% −3% −3%
South −1% 1% −9% 6% −1% −39% 9% −34% 4% 1% 7%
East −1% −2% 2% −3% 1% 18% −2% 11% −3% −2% −1%
West 4% 0% −1% −3% 5% 1% −18% 8% 5% −8% 1%
Figure 5.18 Change in sales for the item IBM desktop computer per region.
b/w printers” in September. This cell has a dark background, indicating a high SelfExp
value, meaning that the cell is an exception. Consider now the sales difference of −15%
for “Sony b/w printers” in November and of −11% in December. The −11% value for
December is marked as an exception, while the −15% value is not, even though −15% is
a bigger deviation than −11%. This is because the exception indicators consider all the
dimensions that a cell is in. Notice that the December sales of most of the other items
have a large positive value, while the November sales do not. Therefore, by considering
the cell’s position in the cube, the sales difference for “Sony b/w printers” in December is
exceptional, while the November sales difference of this item is not.
The InExp values can be used to indicate exceptions at lower levels that are not vis-
ible at the current level. Consider the cells for “IBM desktop computers” in July and
September. These both have a dark, thick box around them, indicating high InExp val-
ues. You may decide to further explore the sales of “IBM desktop computers” by drilling
down along region. The resulting sales difference by region is shown in Figure 5.18, where
the highlight exceptions option has been invoked. The visual cues displayed make it easy
to instantly notice an exception for the sales of “IBM desktop computers” in the southern
region, where such sales have decreased by −39% and −34% in July and September,