
Page 304 -
P. 304
3:20 Page 267
HAN
2011/6/1
#25
13-ch06-243-278-9780123814791
6.3 Which Patterns Are Interesting?—Pattern Evaluation Methods 267
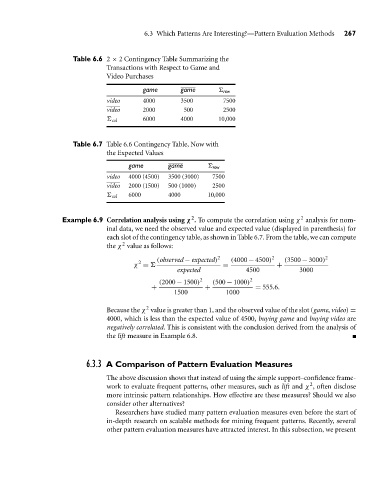
Table 6.6 2 × 2 Contingency Table Summarizing the
Transactions with Respect to Game and
Video Purchases
game game 6 row
video 4000 3500 7500
video 2000 500 2500
6 col 6000 4000 10,000
Table 6.7 Table 6.6 Contingency Table, Now with
the Expected Values
game game 6 row
video 4000 (4500) 3500 (3000) 7500
video 2000 (1500) 500 (1000) 2500
6 col 6000 4000 10,000
2
2
Example 6.9 Correlation analysis using χ . To compute the correlation using χ analysis for nom-
inal data, we need the observed value and expected value (displayed in parenthesis) for
each slot of the contingency table, as shown in Table 6.7. From the table, we can compute
2
the χ value as follows:
(observed − expected) 2 (4000 − 4500) 2 (3500 − 3000) 2
2
χ = 6 = +
expected 4500 3000
(2000 − 1500) 2 (500 − 1000) 2
+ + = 555.6.
1500 1000
2
Because the χ value is greater than 1, and the observed value of the slot (game, video) =
4000, which is less than the expected value of 4500, buying game and buying video are
negatively correlated. This is consistent with the conclusion derived from the analysis of
the lift measure in Example 6.8.
6.3.3 A Comparison of Pattern Evaluation Measures
The above discussion shows that instead of using the simple support–confidence frame-
2
work to evaluate frequent patterns, other measures, such as lift and χ , often disclose
more intrinsic pattern relationships. How effective are these measures? Should we also
consider other alternatives?
Researchers have studied many pattern evaluation measures even before the start of
in-depth research on scalable methods for mining frequent patterns. Recently, several
other pattern evaluation measures have attracted interest. In this subsection, we present