
Page 306 -
P. 306
3:20 Page 269
#27
2011/6/1
HAN
13-ch06-243-278-9780123814791
6.3 Which Patterns Are Interesting?—Pattern Evaluation Methods 269
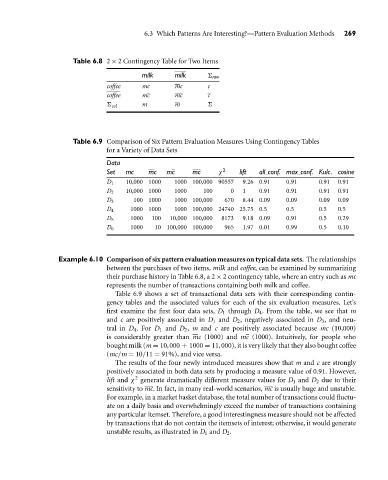
Table 6.8 2 × 2 Contingency Table for Two Items
milk milk 6 row
coffee mc mc c
coffee mc mc c
6 col m m 6
Table 6.9 Comparison of Six Pattern Evaluation Measures Using Contingency Tables
for a Variety of Data Sets
Data
Set mc mc mc mc χ 2 lift all conf. max conf. Kulc. cosine
D 1 10,000 1000 1000 100,000 90557 9.26 0.91 0.91 0.91 0.91
D 2 10,000 1000 1000 100 0 1 0.91 0.91 0.91 0.91
D 3 100 1000 1000 100,000 670 8.44 0.09 0.09 0.09 0.09
D 4 1000 1000 1000 100,000 24740 25.75 0.5 0.5 0.5 0.5
D 5 1000 100 10,000 100,000 8173 9.18 0.09 0.91 0.5 0.29
D 6 1000 10 100,000 100,000 965 1.97 0.01 0.99 0.5 0.10
Example 6.10 Comparison of six pattern evaluation measures on typical data sets. The relationships
between the purchases of two items, milk and coffee, can be examined by summarizing
their purchase history in Table 6.8, a 2 × 2 contingency table, where an entry such as mc
represents the number of transactions containing both milk and coffee.
Table 6.9 shows a set of transactional data sets with their corresponding contin-
gency tables and the associated values for each of the six evaluation measures. Let’s
first examine the first four data sets, D 1 through D 4 . From the table, we see that m
and c are positively associated in D 1 and D 2 , negatively associated in D 3 , and neu-
tral in D 4 . For D 1 and D 2 , m and c are positively associated because mc (10,000)
is considerably greater than mc (1000) and mc (1000). Intuitively, for people who
bought milk (m = 10,000 + 1000 = 11,000), it is very likely that they also bought coffee
(mc/m = 10/11 = 91%), and vice versa.
The results of the four newly introduced measures show that m and c are strongly
positively associated in both data sets by producing a measure value of 0.91. However,
2
lift and χ generate dramatically different measure values for D 1 and D 2 due to their
sensitivity to mc. In fact, in many real-world scenarios, mc is usually huge and unstable.
For example, in a market basket database, the total number of transactions could fluctu-
ate on a daily basis and overwhelmingly exceed the number of transactions containing
any particular itemset. Therefore, a good interestingness measure should not be affected
by transactions that do not contain the itemsets of interest; otherwise, it would generate
unstable results, as illustrated in D 1 and D 2 .