
Page 539 - Decision Making Applications in Modern Power Systems
P. 539
A reliable decision-making algorithm Chapter | 18 497
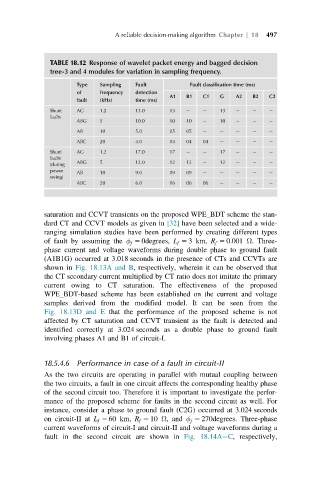
TABLE 18.12 Response of wavelet packet energy and bagged decision
tree-3 and 4 modules for variation in sampling frequency.
Type Sampling Fault Fault classification time (ms)
of frequency detection
A1 B1 C1 G A2 B2 C2
fault (kHz) time (ms)
Shunt AG 1.2 13.0 13 13
faults
ABG 5 10.0 10 10 10
AB 10 5.0 05 05
ABC 20 4.0 04 04 04
Shunt AG 1.2 17.0 17 17
faults
(during ABG 5 12.0 12 12 12
power AB 10 9.0 09 09
swing)
ABC 20 6.0 06 06 06
saturation and CCVT transients on the proposed WPE_BDT scheme the stan-
dard CT and CCVT models as given in [32] have been selected and a wide-
ranging simulation studies have been performed by creating different types
of fault by assuming the φ 5 0degrees, L f 5 3 km, R f 5 0:001 Ω. Three-
f
phase current and voltage waveforms during double phase to ground fault
(A1B1G) occurred at 3.018 seconds in the presence of CTs and CCVTs are
shown in Fig. 18.13A and B, respectively, wherein it can be observed that
the CT secondary current multiplied by CT ratio does not imitate the primary
current owing to CT saturation. The effectiveness of the proposed
WPE_BDT-based scheme has been established on the current and voltage
samples derived from the modified model. It can be seen from the
Fig. 18.13D and E that the performance of the proposed scheme is not
affected by CT saturation and CCVT transient as the fault is detected and
identified correctly at 3.024 seconds as a double phase to ground fault
involving phases A1 and B1 of circuit-I.
18.5.4.6 Performance in case of a fault in circuit-II
As the two circuits are operating in parallel with mutual coupling between
the two circuits, a fault in one circuit affects the corresponding healthy phase
of the second circuit too. Therefore it is important to investigate the perfor-
mance of the proposed scheme for faults in the second circuit as well. For
instance, consider a phase to ground fault (C2G) occurred at 3.024 seconds
on circuit-II at L f 5 60 km, R f 5 10 Ω, and φ 5 270degrees. Three-phase
f
current waveforms of circuit-I and circuit-II and voltage waveforms during a
fault in the second circuit are shown in Fig. 18.14A C, respectively,