
Page 342 - Design for Environment A Guide to Sustainable Product Development
P. 342
Materials Pr oduction Industries 317
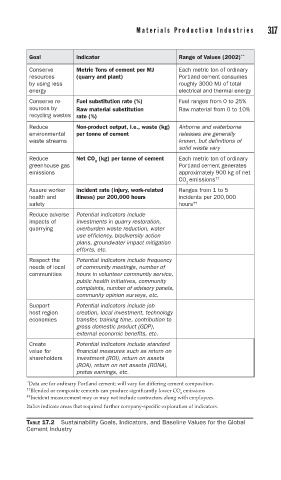
Goal Indicator Range of Values (2002) **
Conserve Metric Tons of cement per MJ Each metric ton of ordinary
resources (quarry and plant) Portland cement consumes
by using less roughly 3000 MJ of total
energy electrical and thermal energy
Conserve re- Fuel substitution rate (%) Fuel ranges from 0 to 25%
sources by Raw material substitution Raw material from 0 to 10%
recycling wastes rate (%)
Reduce Non-product output, i.e., waste (kg) Airborne and waterborne
environmental per tonne of cement releases are generally
waste streams known, but definitions of
solid waste vary
Reduce Net CO (kg) per tonne of cement Each metric ton of ordinary
2
greenhouse gas Portland cement generates
emissions approximately 900 kg of net
CO emissions ††
2
Assure worker Incident rate (injury, work- related Ranges from 1 to 5
health and illness) per 200,000 hours incidents per 200,000
safety hours ‡‡
Reduce adverse Potential indicators include
impacts of investments in quarry restoration,
quarrying overburden waste reduction, water
use efficiency, biodiversity action
plans, groundwater impact mitigation
efforts, etc.
Respect the Potential indicators include frequency
needs of local of community meetings, number of
communities hours in volunteer community service,
public health initiatives, community
complaints, number of advisory panels,
community opinion surveys, etc.
Support Potential indicators include job
host region creation, local investment, technology
economies transfer, training time, contribution to
gross domestic product (GDP),
external economic benefits, etc.
Create Potential indicators include standard
value for financial measures such as return on
shareholders investment (ROI), return on assets
(ROA), return on net assets (RONA),
pretax earnings, etc.
** Data are for ordinary Portland cement; will vary for differing cement composition.
††
Blended or composite cements can produce significantly lower CO emissions
2
‡‡ Incident measurement may or may not include contractors along with employees.
Italics indicate areas that required further company-specific exploration of indicators.
TABLE 17.2 Sustainability Goals, Indicators, and Baseline Values for the Global
Cement Industry