
Page 363 - Design for Environment A Guide to Sustainable Product Development
P. 363
338 Cha pte r Ni netee n
FIGURE 19.1 Average natural capital intensity for 488 sectors of the U.S.
economy in 1997 [1].
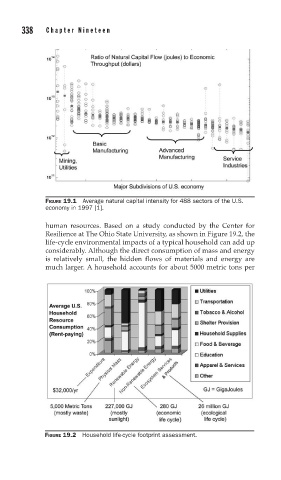
human resources. Based on a study conducted by the Center for
Resilience at The Ohio State University, as shown in Figure 19.2, the
life-cycle environmental impacts of a typical household can add up
considerably. Although the direct consumption of mass and energy
is relatively small, the hidden flows of materials and energy are
much larger. A household accounts for about 5000 metric tons per
FIGURE 19.2 Household life-cycle footprint assessment.