
Page 518 - Design for Six Sigma a Roadmap for Product Development
P. 518
Taguchi’s Orthogonal Array Experiment 477
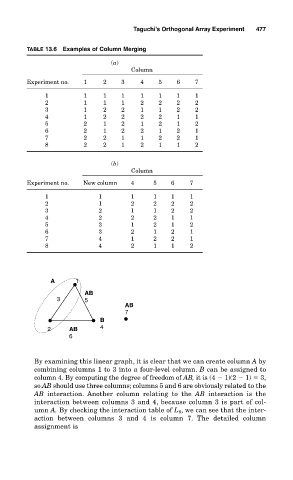
TABLE 13.6 Examples of Column Merging
(a)
Column
Experiment no. 1 2 3 4 5 6 7
1 1 1 1 1 1 1 1
2 1 1 1 2 2 2 2
3 1 2 2 1 1 2 2
4 1 2 2 2 2 1 1
5 2 1 2 1 2 1 2
6 2 1 2 2 1 2 1
7 2 2 1 1 2 2 1
8 2 2 1 2 1 1 2
(b)
Column
Experiment no. New column 4 5 6 7
1 1 1 1 1 1
2 1 2 2 2 2
3 2 1 1 2 2
4 2 2 2 1 1
5 3 1 2 1 2
6 3 2 1 2 1
7 4 1 2 2 1
8 4 2 1 1 2
A 1
AB
3 5
AB
7
B
2 AB 4
6
By examining this linear graph, it is clear that we can create column A by
combining columns 1 to 3 into a four-level column. B can be assigned to
column 4. By computing the degree of freedom of AB, it is (4 1)(2 1) 3,
so AB should use three columns; columns 5 and 6 are obviously related to the
AB interaction. Another column relating to the AB interaction is the
interaction between columns 3 and 4, because column 3 is part of col-
umn A. By checking the interaction table of L 8 , we can see that the inter-
action between columns 3 and 4 is column 7. The detailed column
assignment is