
Page 513 - Design for Six Sigma a Roadmap for Product Development
P. 513
472 Chapter Thirteen
4
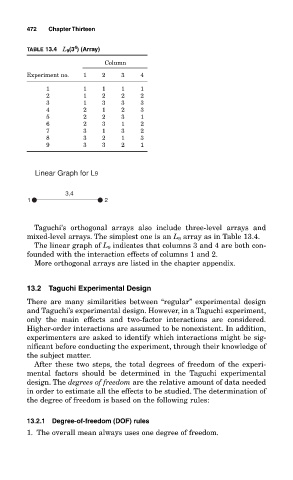
TABLE 13.4 L 9 (3 ) (Array)
Column
Experiment no. 1 2 3 4
1 1 1 1 1
2 1 2 2 2
3 1 3 3 3
4 2 1 2 3
5 2 2 3 1
6 2 3 1 2
7 3 1 3 2
8 3 2 1 3
9 3 3 2 1
Linear Graph for L9
3,4
1 2
Taguchi’s orthogonal arrays also include three-level arrays and
mixed-level arrays. The simplest one is an L 9 array as in Table 13.4.
The linear graph of L 9 indicates that columns 3 and 4 are both con-
founded with the interaction effects of columns 1 and 2.
More orthogonal arrays are listed in the chapter appendix.
13.2 Taguchi Experimental Design
There are many similarities between “regular” experimental design
and Taguchi’s experimental design. However, in a Taguchi experiment,
only the main effects and two-factor interactions are considered.
Higher-order interactions are assumed to be nonexistent. In addition,
experimenters are asked to identify which interactions might be sig-
nificant before conducting the experiment, through their knowledge of
the subject matter.
After these two steps, the total degrees of freedom of the experi-
mental factors should be determined in the Taguchi experimental
design. The degrees of freedom are the relative amount of data needed
in order to estimate all the effects to be studied. The determination of
the degree of freedom is based on the following rules:
13.2.1 Degree-of-freedom (DOF) rules
1. The overall mean always uses one degree of freedom.