
Page 508 - Design for Six Sigma a Roadmap for Product Development
P. 508
Fundamentals of Experimental Design 467
TABLE 12.23 Performance Comparisons of Four Incomplete DOE Analysis Methods
Problem DOE Draper Elementary
No. Type & Stoneman Effects RSM Stepwise
1 2^4 0.074987 0.0295 0.042635 0.082471637
2 2^4 0.161836 0.106043 0.078739 0.496554312
3 2^4 0.063116 0.0972 0.0972 0.214146811
4 2^4 0.34067 0.184594 0.208402 0.052365
5 2^4 0.28144 0.16249 0.113968 0.236763572
6 2^3 0.121658 0.067484 0.033742 0.121658
7 2^3 0.843694 0.374396 0.209976 0.935505432
From Eq. (12.30) we can see that the range of this normalized
Euclidean distance is from 0 to 1; when we have a perfect data analy-
sis method for incomplete DOE, then E E , , for all i 1 to n, and
i i
NED 0, which means that the estimated factorial effects from the
incomplete DOE data set are exactly equal to those obtained from a
complete DOE data set without missing data points. Similarly, when
NED 1.0, then it is the worst case. Actually, NED is a measure of rel-
ative error; the smaller the NED is, the smaller the relative error.
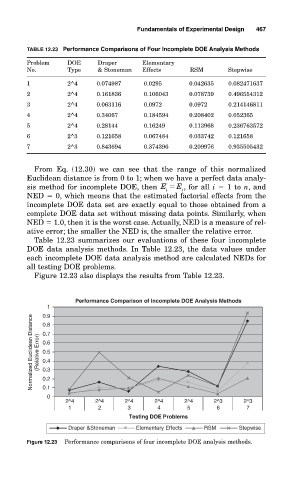
Table 12.23 summarizes our evaluations of these four incomplete
DOE data analysis methods. In Table 12.23, the data values under
each incomplete DOE data analysis method are calculated NEDs for
all testing DOE problems.
Figure 12.23 also displays the results from Table 12.23.
Performance Comparison of Incomplete DOE Analysis Methods
1
Normalized Euclidean Distance (Relative Error) 0.7
0.9
0.8
0.6
0.5
0.4
0.3
0.2
0.1
0
2^4 2^4 2^4 2^4 2^4 2^3 2^3
1 2 3 4 5 6 7
Testing DOE Problems
Draper &Stoneman Elementary Effects RSM Stepwise
Figure 12.23 Performance comparisons of four incomplete DOE analysis methods.