
Page 506 - Design for Six Sigma a Roadmap for Product Development
P. 506
Fundamentals of Experimental Design 465
well-known empirical model-building technology (Efroymsonin 1960,
Draper and Simith 1981) that can select a “best subset” of variables from
a long list of candidate variables. The selected best subset of variables is
the statistically significant variables that influence the response variable
Y the most. Stepwise regression is a well-established methodology, and
there are numerous publications on this topic, so we will not explain the
details of this methodology here.
When we deal with incomplete factorial experimental data by using
the stepwise regression approach, the complete list of candidate vari-
ables will be all the factorial effects, such as A, B, C, AB, AC, ..., ABC, ...
and so on. Then we will use the stepwise regression method to select a
best subset of the factorial effects and build a model from these effects.
In this book, we illustrate the stepwise regression method by applying
it to Example 12.10. Specifically, we will use the data in Table 12.22 with
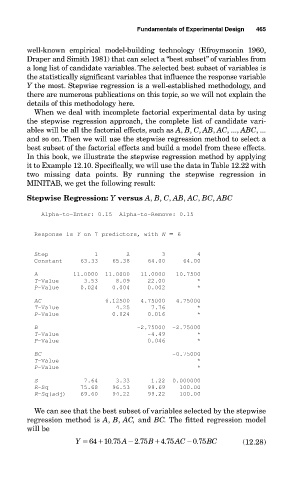
two missing data points. By running the stepwise regression in
MINITAB, we get the following result:
Stepwise Regression: Y versus A, B, C, AB, AC, BC, ABC
Alpha-to-Enter: 0.15 Alpha-to-Remove: 0.15
Response is Y on 7 predictors, with N 6
Step 1 2 3 4
Constant 63.33 65.38 64.00 64.00
A 11.0000 11.0000 11.0000 10.7500
T-Value 3.53 8.09 22.00 *
P-Value 0.024 0.004 0.002 *
AC 6.12500 4.75000 4.75000
T-Value 4.25 7.76 *
P-Value 0.024 0.016 *
B -2.75000 -2.75000
T-Value -4.49 *
P-Value 0.046 *
BC -0.75000
T-Value *
P-Value *
S 7.64 3.33 1.22 0.000000
R-Sq 75.68 96.53 99.69 100.00
R-Sq(adj) 69.60 94.22 99.22 100.00
We can see that the best subset of variables selected by the stepwise
regression method is A, B, AC, and BC. The fitted regression model
will be
.
.
.
Y 64 10 75 A 2 75 B 4 75 AC 0 75 BC (12.28)
.