
Page 511 - Design for Six Sigma a Roadmap for Product Development
P. 511
470 Chapter Thirteen
3
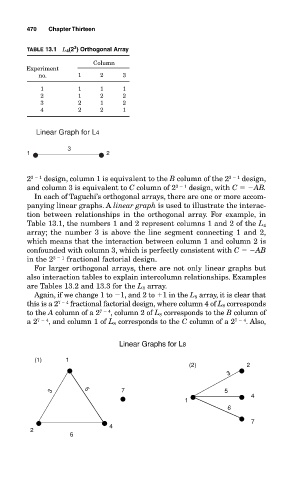
TABLE 13.1 L 4 (2 ) Orthogonal Array
Column
Experiment
no. 1 2 3
1 1 1 1
2 1 2 2
3 2 1 2
4 2 2 1
Linear Graph for L4
3
1 2
2 3 1 design, column 1 is equivalent to the B column of the 2 3 1 design,
and column 3 is equivalent to C column of 2 3 1 design, with C AB.
In each of Taguchi’s orthogonal arrays, there are one or more accom-
panying linear graphs. A linear graph is used to illustrate the interac-
tion between relationships in the orthogonal array. For example, in
Table 13.1, the numbers 1 and 2 represent columns 1 and 2 of the L 4
array; the number 3 is above the line segment connecting 1 and 2,
which means that the interaction between column 1 and column 2 is
confounded with column 3, which is perfectly consistent with C AB
in the 2 3 1 fractional factorial design.
For larger orthogonal arrays, there are not only linear graphs but
also interaction tables to explain intercolumn relationships. Examples
are Tables 13.2 and 13.3 for the L 8 array.
Again, if we change 1 to 1, and 2 to 1 in the L 8 array, it is clear that
this is a 2 7 4 fractional factorial design, where column 4 of L 8 corresponds
to the A column of a 2 7 4 , column 2 of L 8 corresponds to the B column of
a 2 7 4 , and column 1 of L 8 corresponds to the C column of a 2 7 4 . Also,
Linear Graphs for L8
(1) 1
(2) 2
3
3 5 7 5
4
1
6
7
4
2
6