Page 507 - Design for Six Sigma a Roadmap for Product Development
P. 507
466   Chapter Twelve


             Compared with the linear regression model from the original data
           set:

                     .
               Y  64 25  11 5 A 2 5 B 0 75 C 0 75 AB 5 AC 0 25  ABC   (12.29)
                           .
                                 .
                                                             .
                                       .
                                              .
             We can see that the estimated linear coefficients for A and B from
           the stepwise regression method on incomplete data are pretty close to
           what we got from the full data set, but there are significant discrep-
           ancies on other factorial effects. In our study, we find that the stepwise
           regression can usually pick up a few important factorial effects with
           relatively good accuracy, but it usually misses a few other significant
           effects (Siddiqui and Yang 2008).
           12.6.3    Comparisons of incomplete factorial
           experimental data analysis methods
           In previous subsections, we have discussed four methods that can be
           used to analyze the experimental data from incomplete factorial exper-
           iments. Siddiqui and Yang (2008) conducted a study to compare these
           four methods. In this study, seven two-level factorial experiment prob-
           lems are selected from real industrial cases or reputable publications.
                                         4
                                              3
           All these problems are either 2 or 2 factorial experiments. In each,
           two response data points are randomly picked and crossed out as miss-
           ing data points. Then we tried all four methods on those problems with
           missing data.
             Since the factorial effects calculation, that is, the estimation of main
           effects A, B, C, and interactions, AB, AC, and so on, is the basis for two-
           level factorial experimental data analysis, we compared the differ-
           ences between the factorial effects calculation with no missing data to
           the factorial effects calculation with missing data, as the measure of
           quality for incomplete factorial experimental data analysis methods.
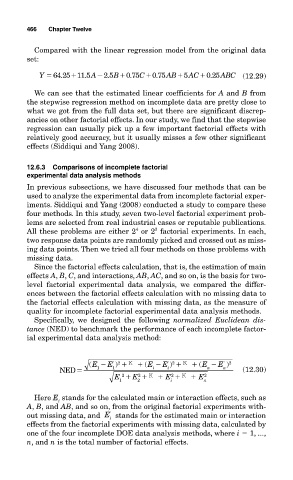
             Specifically, we designed the following  normalized Euclidean dis-
           tance (NED) to benchmark the performance of each incomplete factor-
           ial experimental data analysis method:


                                                  )
                                   )
                            (E   E ' 2    K    (E   E ' 2    K    (E   E  '  ) 2
                    NED       1    1          i   i         n    n    (12.30)
                                     2
                                                   2
                                          2
                                   E E   E   K     E   K     E 2
                                    1    2        i        n
             Here E stands for the calculated main or interaction effects, such as
                    i
           A, B, and AB, and so on, from the original factorial experiments with-
           out missing data, and  E i '  stands for the estimated main or interaction
           effects from the factorial experiments with missing data, calculated by
           one of the four incomplete DOE data analysis methods, where i   1, ...,
           n, and n is the total number of factorial effects.

