
Page 512 - Design for Six Sigma a Roadmap for Product Development
P. 512
Taguchi’s Orthogonal Array Experiment 471
7
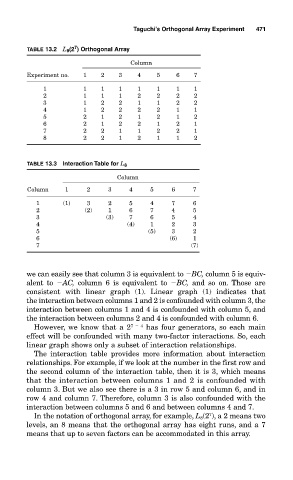
TABLE 13.2 L 8 (2 ) Orthogonal Array
Column
Experiment no. 1 2 3 4 5 6 7
1 1 1 1 1 1 1 1
2 1 1 1 2 2 2 2
3 1 2 2 1 1 2 2
4 1 2 2 2 2 1 1
5 2 1 2 1 2 1 2
6 2 1 2 2 1 2 1
7 2 2 1 1 2 2 1
8 2 2 1 2 1 1 2
TABLE 13.3 Interaction Table for L 8
Column
Column 1 2 3 4 5 6 7
1 (1) 3 2 5 4 7 6
2 (2) 1 6 7 4 5
3 (3) 7 6 5 4
4 (4) 1 2 3
5 (5) 3 2
6 (6) 1
7 (7)
we can easily see that column 3 is equivalent to BC, column 5 is equiv-
alent to AC, column 6 is equivalent to BC, and so on. Those are
consistent with linear graph (1). Linear graph (1) indicates that
the interaction between columns 1 and 2 is confounded with column 3, the
interaction between columns 1 and 4 is confounded with column 5, and
the interaction between columns 2 and 4 is confounded with column 6.
However, we know that a 2 7 4 has four generators, so each main
effect will be confounded with many two-factor interactions. So, each
linear graph shows only a subset of interaction relationships.
The interaction table provides more information about interaction
relationships. For example, if we look at the number in the first row and
the second column of the interaction table, then it is 3, which means
that the interaction between columns 1 and 2 is confounded with
column 3. But we also see there is a 3 in row 5 and column 6, and in
row 4 and column 7. Therefore, column 3 is also confounded with the
interaction between columns 5 and 6 and between columns 4 and 7.
7
In the notation of orthogonal array, for example, L 8 (2 ), a 2 means two
levels, an 8 means that the orthogonal array has eight runs, and a 7
means that up to seven factors can be accommodated in this array.