
Page 590 - Design for Six Sigma a Roadmap for Product Development
P. 590
Design Optimization: Advanced Taguchi Robust Parameter Design 547
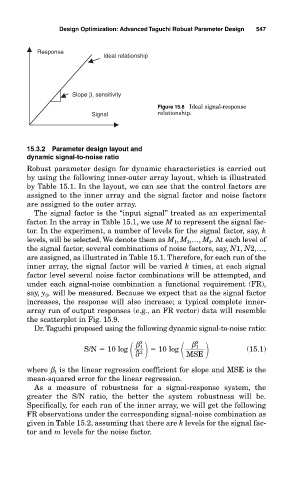
Response
Ideal relationship
Slope β, sensitivity
Figure 15.8 Ideal signal-response
Signal relationship.
15.3.2 Parameter design layout and
dynamic signal-to-noise ratio
Robust parameter design for dynamic characteristics is carried out
by using the following inner-outer array layout, which is illustrated
by Table 15.1. In the layout, we can see that the control factors are
assigned to the inner array and the signal factor and noise factors
are assigned to the outer array.
The signal factor is the “input signal” treated as an experimental
factor. In the array in Table 15.1, we use M to represent the signal fac-
tor. In the experiment, a number of levels for the signal factor, say, k
levels, will be selected. We denote them as M 1 , M 2 ,…, M k . At each level of
the signal factor, several combinations of noise factors, say, N1, N2,…,
are assigned, as illustrated in Table 15.1. Therefore, for each run of the
inner array, the signal factor will be varied k times, at each signal
factor level several noise factor combinations will be attempted, and
under each signal-noise combination a functional requirement (FR),
say, y ij , will be measured. Because we expect that as the signal factor
increases, the response will also increase; a typical complete inner-
array run of output responses (e.g., an FR vector) data will resemble
the scatterplot in Fig. 15.9.
Dr. Taguchi proposed using the following dynamic signal-to-noise ratio:
β 1 2
2
β 1
S/N 10 log 10 log (15.1)
^
2
MSE
where β 1 is the linear regression coefficient for slope and MSE is the
mean-squared error for the linear regression.
As a measure of robustness for a signal-response system, the
greater the S/N ratio, the better the system robustness will be.
Specifically, for each run of the inner array, we will get the following
FR observations under the corresponding signal-noise combination as
given in Table 15.2, assuming that there are k levels for the signal fac-
tor and m levels for the noise factor.