
Page 362 - Design for Six Sigma for Service (Six SIGMA Operational Methods)
P. 362
322 Chapter Ten
The placement and size of buffers has an impact on inventory costs and
system throughput. If the entire line stopped every time a part was
unavailable or a station failed, the line would be going down. Buffers allow
workstations to operate independently thus cushioning the effects of scrap,
part shortages, unequal production rates, workstation failures, or operator
delays. However, lean manufacturing advocates strongly disagree about the
use of buffers. They think the in-process inventories tie up the capital, hide
the operation problems, and reduce the quality.
Many products are not produced in sufficient quantities to justify a
dedicated line. Frequently a production or assembly line is used to produce
a family of similar products. Products are produced in batch runs in which
the line is temporarily shut down for product changeovers while machine
adjustments are made for the next product. The lean manufacturing process
developed quick setup procedures so that the changeover time could be
reduced to a minimum.
Production and assembly lines may be either paced, in which movement
occurs at a fixed rate and the operator must keep pace with the line, or they
may be unpaced, in which the rate of flow is determined only by the speed
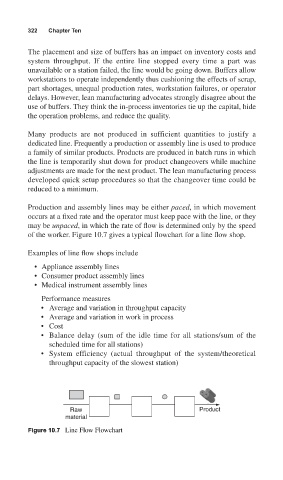
of the worker. Figure 10.7 gives a typical flowchart for a line flow shop.
Examples of line flow shops include
• Appliance assembly lines
• Consumer product assembly lines
• Medical instrument assembly lines
Performance measures
• Average and variation in throughput capacity
• Average and variation in work in process
• Cost
• Balance delay (sum of the idle time for all stations/sum of the
scheduled time for all stations)
• System efficiency (actual throughput of the system/theoretical
throughput capacity of the slowest station)
Raw Product
material
Figure 10.7 Line Flow Flowchart