
Page 300 - Design of Simple and Robust Process Plants
P. 300
286 Chapter 8 Instrumentation, Automation of Operation and Control
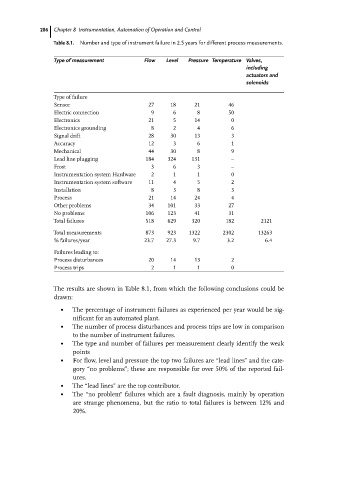
Table 8.1. Number and type of instrument failure in 2.5 years for different process measurements.
Type of measurement Flow Level Pressure Temperature Valves,
including
actuators and
solenoids
Type of failure
Sensor 27 18 21 46
Electric connection 9 6 8 50
Electronics 21 5 14 0
Electronics grounding 8 2 4 6
Signal drift 28 30 13 3
Accuracy 12 3 6 1
Mechanical 44 30 8 9
Lead line plugging 184 324 131 ±
Frost 3 6 3 ±
Instrumentation system Hardware 2 1 1 0
Instrumentation system software 11 4 5 2
Installation 8 3 8 3
Process 21 14 24 4
Other problems 34 101 33 27
No problems 106 123 41 31
Total failures 518 629 320 182 2121
Total measurements 873 923 1322 2302 13263
% failures/year 23.7 27.3 9.7 3.2 6.4
Failures leading to:
Process disturbances 20 14 13 2
Process trips 2 1 1 0
The results are shown in Table 8.1, from which the following conclusions could be
drawn:
. The percentage of instrument failures as experienced per year would be sig-
nificant for an automated plant.
. The number of process disturbances and process trips are low in comparison
to the number of instrument failures.
. The type and number of failures per measurement clearly identify the weak
points
. For flow, level and pressure the top two failures are ªlead linesº and the cate-
gory ªno problemsº; these are responsible for over 50% of the reported fail-
ures.
. The ªlead linesº are the top contributor.
. The ªno problemº failures which are a fault diagnosis, mainly by operation
are strange phenomena, but the ratio to total failures is between 12% and
20%.