
Page 218 - Designing Sociable Robots
P. 218
breazeal-79017 book March 18, 2002 14:16
Expressive Vocalization System 199
Table 11.8
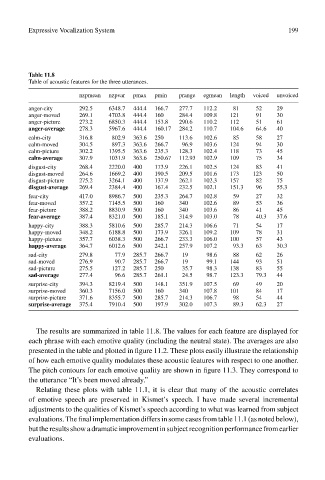
Table of acoustic features for the three utterances.
nzpmean nzpvar pmax pmin prange egmean length voiced unvoiced
anger-city 292.5 6348.7 444.4 166.7 277.7 112.2 81 52 29
anger-moved 269.1 4703.8 444.4 160 284.4 109.8 121 91 30
anger-picture 273.2 6850.3 444.4 153.8 290.6 110.2 112 51 61
anger-average 278.3 5967.6 444.4 160.17 284.2 110.7 104.6 64.6 40
calm-city 316.8 802.9 363.6 250 113.6 102.6 85 58 27
calm-moved 304.5 897.3 363.6 266.7 96.9 103.6 124 94 30
calm-picture 302.2 1395.5 363.6 235.3 128.3 102.4 118 73 45
calm-average 307.9 1031.9 363.6 250.67 112.93 102.9 109 75 34
disgust-city 268.4 2220.0 400 173.9 226.1 102.5 124 83 41
disgust-moved 264.6 1669.2 400 190.5 209.5 101.6 173 123 50
disgust-picture 275.2 3264.1 400 137.9 262.1 102.3 157 82 75
disgust-average 269.4 2384.4 400 167.4 232.5 102.1 151.3 96 55.3
fear-city 417.0 8986.7 500 235.3 264.7 102.8 59 27 32
fear-moved 357.2 7145.5 500 160 340 102.6 89 53 36
fear-picture 388.2 8830.9 500 160 340 103.6 86 41 45
fear-average 387.4 8321.0 500 185.1 314.9 103.0 78 40.3 37.6
happy-city 388.3 5810.6 500 285.7 214.3 106.6 71 54 17
happy-moved 348.2 6188.8 500 173.9 326.1 109.2 109 78 31
happy-picture 357.7 6038.3 500 266.7 233.3 106.0 100 57 43
happy-average 364.7 6012.6 500 242.1 257.9 107.2 93.3 63 30.3
sad-city 279.8 77.9 285.7 266.7 19 98.6 88 62 26
sad-moved 276.9 90.7 285.7 266.7 19 99.1 144 93 51
sad-picture 275.5 127.2 285.7 250 35.7 98.3 138 83 55
sad-average 277.4 96.6 285.7 261.1 24.5 98.7 123.3 79.3 44
surprise-city 394.3 8219.4 500 148.1 351.9 107.5 69 49 20
surprise-moved 360.3 7156.0 500 160 340 107.8 101 84 17
surprise-picture 371.6 8355.7 500 285.7 214.3 106.7 98 54 44
surprise-average 375.4 7910.4 500 197.9 302.0 107.3 89.3 62.3 27
The results are summarized in table 11.8. The values for each feature are displayed for
each phrase with each emotive quality (including the neutral state). The averages are also
presented in the table and plotted in figure 11.2. These plots easily illustrate the relationship
of how each emotive quality modulates these acoustic features with respect to one another.
The pitch contours for each emotive quality are shown in figure 11.3. They correspond to
the utterance “It’s been moved already.”
Relating these plots with table 11.1, it is clear that many of the acoustic correlates
of emotive speech are preserved in Kismet’s speech. I have made several incremental
adjustments to the qualities of Kismet’s speech according to what was learned from subject
evaluations. The final implementation differs in some cases from table 11.1 (as noted below),
but the results show a dramatic improvement in subject recognition performance from earlier
evaluations.