
Page 255 - Digital Analysis of Remotely Sensed Imagery
P. 255
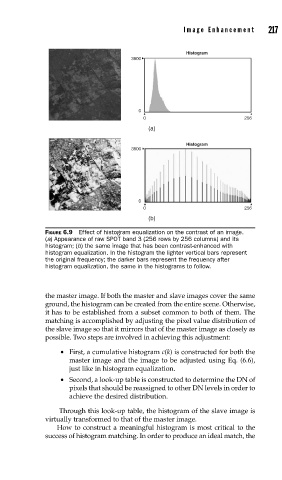
Image Enhancement       217


                                                      Histogram
                                       3800


                                         0
                                          0                           256
                                            (a)

                                                      Histogram
                                       3800


                                         0
                                          0                           256
                                            (b)
               FIGURE 6.9  Effect of histogram equalization on the contrast of an image.
               (a) Appearance of raw SPOT band 3 (256 rows by 256 columns) and its
               histogram; (b) the same image that has been contrast-enhanced with
               histogram equalization. In the histogram the lighter vertical bars represent
               the original frequency; the darker bars represent the frequency after
               histogram equalization, the same in the histograms to follow.


               the master image. If both the master and slave images cover the same
               ground, the histogram can be created from the entire scene. Otherwise,
               it has to be established from a subset common to both of them. The
               matching is accomplished by adjusting the pixel value distribution of
               the slave image so that it mirrors that of the master image as closely as
               possible. Two steps are involved in achieving this adjustment:

                    •  First, a cumulative histogram c(k) is constructed for both the
                      master image and the image to be adjusted using Eq. (6.6),
                      just like in histogram equalization.
                    •  Second, a look-up table is constructed to determine the DN of
                      pixels that should be reassigned to other DN levels in order to
                      achieve the desired distribution.

                    Through this look-up table, the histogram of the slave image is
               virtually transformed to that of the master image.
                   How to construct a meaningful histogram is most critical to the
               success of histogram matching. In order to produce an ideal match, the