
Page 84 - Discrimination at Work The Psychological and Organizational Bases
P. 84
54
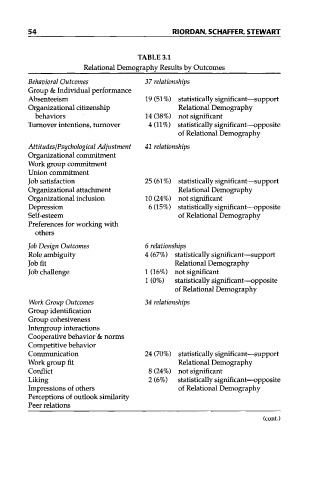
Relational Demography Results by Outcomes
37 relationships
Behavioral Outcomes TABLE 3.1 RIORDAN, SCHAFFER, STEWART
Group & Individual performance
Absenteeism 19 (51%) statistically significant—support
Organizational citizenship Relational Demography
behaviors 14 (38%) not significant
Turnover intentions, turnover 4(11%) statistically significant—opposite
of Relational Demography
Attitudes/Psychological Adjustment 41 relationships
Organizational commitment
Work group commitment
Union commitment
Job satisfaction 25 (61%) statistically significant—support
Organizational attachment Relational Demography
Organizational inclusion 10 (24%) not significant
Depression 6 (15%) statistically significant—opposite
Self-esteem of Relational Demography
Preferences for working with
others
Job Design Outcomes 6 relationships
Role ambiguity 4 (67%) statistically significant—support
Job fit Relational Demography
Job challenge 1 (16%) not significant
1 (0%) statistically significant—opposite
of Relational Demography
Work Group Outcomes 34 relationships
Group identification
Group cohesiveness
Intergroup interactions
Cooperative behavior & norms
Competitive behavior
Communication 24 (70%) statistically significant—support
Work group fit Relational Demography
Conflict 8 (24%) not significant
Liking 2 (6%) statistically significant—opposite
Impressions of others of Relational Demography
Perceptions of outlook similarity
Peer relations
(cont.)