Page 148 - Distributed model predictive control for plant-wide systems
P. 148

122                           Distributed Model Predictive Control for Plant-Wide Systems


             The transfer functions of these three subsystems are, respectively,
                                                4.05e −27s
                                         G (s)=
                                          1
                                                 50s + 1
                                                5.72e −14s
                                         G (s)=
                                          2
                                                 60s + 1
                                                  7.20
                                          G (s)=
                                           3
                                                 19s + 1
                                             [        ]
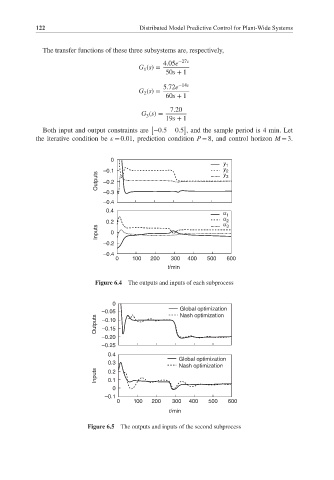
             Both input and output constraints are −0.5  0.5 , and the sample period is 4 min. Let
           the iterative condition be    = 0.01, prediction condition P = 8, and control horizon M = 3.

                                 0
                                                                 y 1
                               –0.1                              y 2
                             Outputs  –0.2                       y 3
                               –0.3
                               –0.4
                                0.4
                                                                 u 1
                                0.2                              u 2
                                                                 u 3
                             Inputs  0
                               –0.2
                               –0.4
                                  0    100  200   300  400   500  600
                                                 t/min
                            Figure 6.4  The outputs and inputs of each subprocess


                                 0
                                                     Global optimization
                              –0.05                  Nash optimization
                             Outputs  –0.10
                              –0.15
                              –0.20
                              –0.25
                                0.4
                                                     Global optimization
                                0.3
                                                     Nash optimization
                             Inputs  0.2
                                0.1
                                 0
                               –0.1
                                   0    100  200   300  400  500   600
                                                  t/min
                          Figure 6.5  The outputs and inputs of the second subprocess
   143   144   145   146   147   148   149   150   151   152   153