Page 181 - Distributed model predictive control for plant-wide systems
P. 181

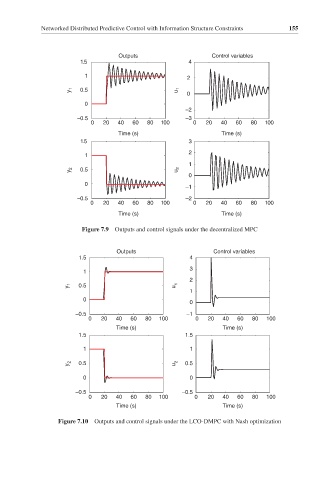
Networked Distributed Predictive Control with Information Structure Constraints  155


                                   Outputs                    Control variables
                        1.5                            4
                         1                             2

                     y 1  0.5                       u 1
                                                       0
                         0
                                                       –2
                       –0.5                            –3
                           0    20  40  60  80  100      0    20  40  60  80  100
                                   Time (s)                      Time (s)
                        1.5                            3
                                                       2
                         1
                                                       1
                     y 2  0.5                       u 2
                                                       0
                         0
                                                       –1
                       –0.5                            –2
                           0    20  40  60  80  100      0    20  40  60  80  100
                                   Time (s)                      Time (s)

                         Figure 7.9  Outputs and control signals under the decentralized MPC


                                   Outputs                     Control variables
                        1.5                             4
                                                        3
                         1
                                                        2
                     y 1  0.5                       u 1
                                                        1
                         0
                                                        0
                       –0.5                            –1
                           0    20  40  60  80  100      0    20  40  60  80  100
                                   Time (s)                      Time (s)
                        1.5                           1.5
                         1                              1

                     y 2  0.5                       u 2  0.5

                         0                              0
                       –0.5                          –0.5
                           0    20  40  60  80  100      0    20  40  60  80  100
                                   Time (s)                      Time (s)
                  Figure 7.10  Outputs and control signals under the LCO-DMPC with Nash optimization
   176   177   178   179   180   181   182   183   184   185   186