
Page 396 - Dust Explosions in the Process Industries
P. 396
Propagation of Flames in Dust Clouds 365
2(m/~)~/s,respectively,correspondingto a turbulent time scale k/E= 5 ms. The particles
were treated as a second hypothetical continuous phase interacting with the gas phase
and having the microscopic properties of monosized peat particles of diameter d.
Comparatively simple submodels of particle drying, pyrolysis or devolatilization, gas
combustion, and char combustion were incorporated. The two continuous phases were
assumed to interact by transport of material from the particle phase to the gas phase and
transport of heat in both directions, depending on whether the gas or the char was burn-
ing. The rate of the chemical gas phase reaction was assumed to be controlled by tur-
bulent diffusion, that is, by elk. The fuel consumption under these circumstances was
calculated using the expressionproposed by Magnussen and Hjertager (1976).Kjaldman
estimated the role of thermal radiation to be small for the actual type of particles and used
a simplified treatment to account for this effect.
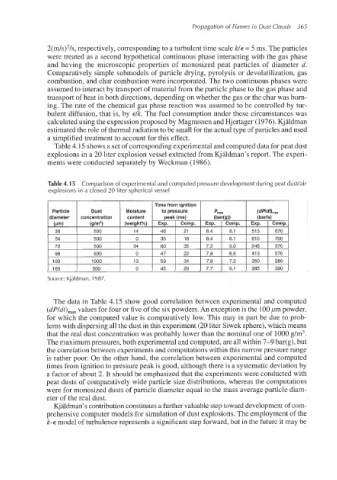
Table 4.15 shows a set of correspondingexperimentaland computed data for peat dust
explosions in a 20 liter explosion vessel extracted from Kjaldman’s report. The experi-
ments were conducted separatelyby Weckman (1986).
Table 4.1 5 Comparison of experimental and computed pressure development during peat dudair
explosions in a closed 20 liter spherical vessel
Source: Kjaldman, 1987.
The data in Table 4.15 show good correlation between experimental and computed
(dPldt),, values for four or five of the six powders. An exceptionis the 100pm powder,
for which the computed value is comparatively low. This may in part be due to prob-
lems with dispersing all the dust in this experiment (20 liter Siwek sphere),which means
that the real dust concentrationwas probably lower than the nominal one of 1000g/m3.
The maximum pressures,both experimentaland computed,are all within 7-9 bar&), but
the correlationbetween experiments and computations within this narrow pressure range
is rather poor. On the other hand, the correlation between experimental and computed
times from ignition to pressure peak is good, although there is a systematic deviation by
a factor of about 2. It should be emphasized that the experiments were conducted with
peat dusts of comparatively wide particle size distributions, whereas the computations
were for monosized dusts of particle diameter equal to the mass average particle diam-
eter of the real dust.
Kjaldman’scontributionconstitutesa further valuable step toward developmentof com-
prehensive computer models for simulation of dust explosions. The employment of the
k-E model of turbulence represents a significant step forward, but in the future it may be