
Page 438 - Dust Explosions in the Process Industries
P. 438
Ignition of Dust Clouds and Dust Deposits 405
IO6 I
EMPIRICAL LINE REPRESENTING
CORRESPONDING TO THE EQUATION:
10-2 10-1 1 10 102
SPARK CURRENT, Is [AI
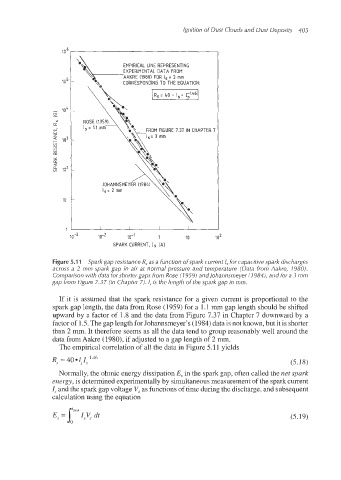
Figure 5.1 1 Spark gap resistance R, as a function of spark current I, for capacitive spark discharges
across a 2 mm spark gap in air at normal pressure and temperature (Data from Aakre, 1980).
Comparison with data for shorter gaps from Rose (I 959) andlohannsmeyer (1 9841, and for a 3 mm
gap from Figure 7.37 (in Chapter 7). I, is the length of the spark gap in mm.
If it is assumed that the spark resistance for a given current is proportional to the
spark gap length, the data from Rose (1959) for a 1.1 mm gap length should be shifted
upward by a factor of 1.8 and the data from Figure 7.37 in Chapter 7 downward by a
factor of 1.5.The gap length for Johannsmeyer’s(1984) data is not known, but it is shorter
than 2 mm. It therefore seems as all the data tend to group reasonably well around the
data from Aakre (1980), if adjusted to a gap length of 2 mm.
The empirical correlation of all the data in Figure 5.11 yields
(5.18)
Normally, the ohmic energy dissipationE, in the spark gap, often called the net spark
energy, is determinedexperimentallyby simultaneousmeasurementof the spark current
1,and the spark gap voltage V,as functions of time during the discharge,and subsequent
calculation using the equation
(5.19)