
Page 515 - Dust Explosions in the Process Industries
P. 515
482 Dust Explosions in the Process Industries
SIZE DISTRIBUTION - 0.0% MOISTURE
t OF INDIVIDUAL ..____.12.6% MOISTURE
z
3 STARCH GRAINS
W
d
W
LT
U
E
m
5
z
0 10 20 30 40 50 60 70 80
GRAIN/AGGLOMERATE UIAMETER [pml
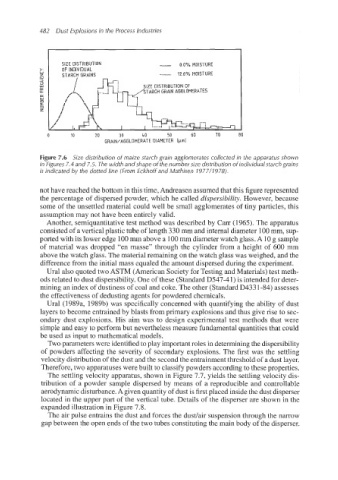
Figure 7.6 Size distribution of maize starch grain agglomerates collected in the apparatus shown
in Figures 7.4 and 7.5. The width and shape of the number size distribution of individual starch grains
is indicated by the dotted line (From Eckhoff and Mathisen 1977/1978).
not have reached the bottom in this time,Andreasen assumed that this figure represented
the percentage of dispersed powder, which he called dispersibility. However, because
some of the unsettled material could well be small agglomerates of tiny particles, this
assumption may not have been entirely valid.
Another, semiquantitative test method was described by Carr (1965). The apparatus
consisted of a vertical plastic tube of length 330 mm and internal diameter 100mm, sup-
ported with its lower edge 100mm above a 100mm diameterwatch glass.A 10 g sample
of material was dropped “en masse” through the cylinder from a height of 600 mm
above the watch glass. The material remaining on the watch glass was weighed, and the
difference from the initial mass equaled the amount dispersed during the experiment.
Ural also quoted two ASTM (American Society for Testing and Materials) test meth-
ods related to dust dispersibility.One of these (StandardD547-41) is intended for deter-
mining an index of dustiness of coal and coke. The other (StandardD4331-84) assesses
the effectiveness of dedusting agents for powdered chemicals.
Ural (1989a, 1989b) was specifically concerned with quantifying the ability of dust
layers to become entrained by blasts from primary explosions and thus give rise to sec-
ondary dust explosions. His aim was to design experimental test methods that were
simple and easy to perform but nevertheless measure fundamental quantities that could
be used as input to mathematical models.
Two parameters were identifiedto play important roles in determiningthe dispersibility
of powders affecting the severity of secondary explosions. The first was the settling
velocity distribution of the dust and the second the entrainmentthreshold of a dust layer.
Therefore, two apparatuses were built to classify powders according to these properties.
The settling velocity apparatus, shown in Figure 7.7, yields the settling velocity dis-
tribution of a powder sample dispersed by means of a reproducible and controllable
aerodynamic disturbance.A given quantity of dust is first placed inside the dust disperser
located in the upper part of the vertical tube. Details of the disperser are shown in the
expanded illustration in Figure 7.8.
The air pulse entrains the dust and forces the dudair suspension through the narrow
gap between the open ends of the two tubes constitutingthe main body of the disperser.