
Page 62 - Dynamics and Control of Nuclear Reactors
P. 62
54 CHAPTER 5 Subcritical operation
proportionally-measured quantity) increases linearly with decreasing negative reac-
tivity in a subcritical reactor. An example of a quantity that is measured is the neutron
detector count rate, pulses/s.
5.3 The inverse multiplication factor
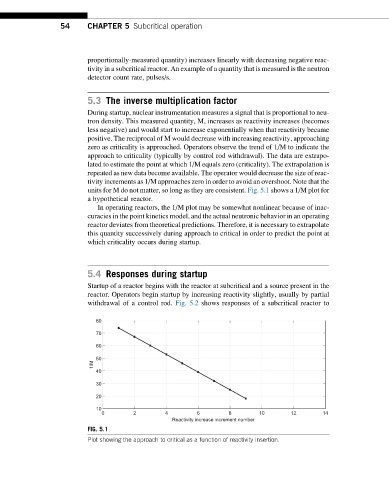
During startup, nuclear instrumentation measures a signal that is proportional to neu-
tron density. This measured quantity, M, increases as reactivity increases (becomes
less negative) and would start to increase exponentially when that reactivity became
positive. The reciprocal of M would decrease with increasing reactivity, approaching
zero as criticality is approached. Operators observe the trend of 1/M to indicate the
approach to criticality (typically by control rod withdrawal). The data are extrapo-
lated to estimate the point at which 1/M equals zero (criticality). The extrapolation is
repeated as new data become available. The operator would decrease the size of reac-
tivity increments as 1/M approaches zero in order to avoid an overshoot. Note that the
units for M do not matter, so long as they are consistent. Fig. 5.1 shows a 1/M plot for
a hypothetical reactor.
In operating reactors, the 1/M plot may be somewhat nonlinear because of inac-
curacies in the point kinetics model, and the actual neutronic behavior in an operating
reactor deviates from theoretical predictions. Therefore, it is necessary to extrapolate
this quantity successively during approach to critical in order to predict the point at
which criticality occurs during startup.
5.4 Responses during startup
Startup of a reactor begins with the reactor at subcritical and a source present in the
reactor. Operators begin startup by increasing reactivity slightly, usually by partial
withdrawal of a control rod. Fig. 5.2 shows responses of a subcritical reactor to
80
70
60
50
1/M
40
30
20
10
0 2 4 6 8 10 12 14
Reactivity increase increment number
FIG. 5.1
Plot showing the approach to critical as a function of reactivity insertion.