
Page 64 - Dynamics and Control of Nuclear Reactors
P. 64
56 CHAPTER 5 Subcritical operation
a. Plot the time history of the fractional power (as a function of time),
making sure that the power comes to a near steady-state value before
the next reactivity insertion.
b. Plot the steady-state inverse power ratio P(0)/P, as a function of reac-
tivity. Explain the behavior of this parameter as a function of reactivity.
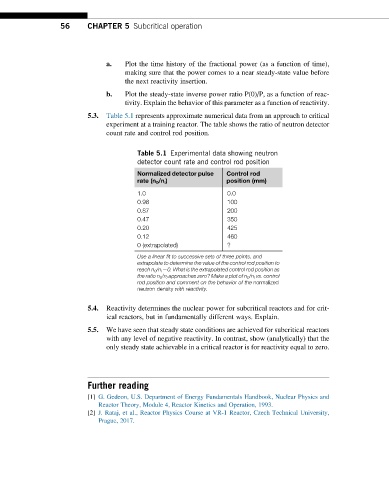
5.3. Table 5.1 represents approximate numerical data from an approach to critical
experiment at a training reactor. The table shows the ratio of neutron detector
count rate and control rod position.
Table 5.1 Experimental data showing neutron
detector count rate and control rod position
Normalized detector pulse Control rod
rate (n 0 /n i ) position (mm)
1.0 0.0
0.98 100
0.87 200
0.47 350
0.20 425
0.12 460
0 (extrapolated) ?
Use a linear fit to successive sets of three points, and
extrapolate to determine the value of the control rod position to
reach n 0 /n i ¼0. What is the extrapolated control rod position as
the ratio n 0 /n i approaches zero? Make a plot of n 0 /n i vs. control
rod position and comment on the behavior of the normalized
neutron density with reactivity.
5.4. Reactivity determines the nuclear power for subcritical reactors and for crit-
ical reactors, but in fundamentally different ways. Explain.
5.5. We have seen that steady state conditions are achieved for subcritical reactors
with any level of negative reactivity. In contrast, show (analytically) that the
only steady state achievable in a critical reactor is for reactivity equal to zero.
Further reading
[1] G. Gedeon, U.S. Department of Energy Fundamentals Handbook, Nuclear Physics and
Reactor Theory, Module 4, Reactor Kinetics and Operation, 1993.
[2] J. Rataj, et al., Reactor Physics Course at VR-1 Reactor, Czech Technical University,
Prague, 2017.