
Page 233 - E-Bussiness and E-Commerce Management Strategy, Implementation, and Practice
P. 233
M04_CHAF9601_04_SE_C04.QXD:D01_CHAF7409_04_SE_C01.QXD 16/4/09 11:11 Page 200
200 Part 1 Introduction
The authors of the report note that:
significant (national) variation exists in what citizens perceive to be the most important
barriers to further use, and in governments’ chosen role in tackling those barriers. Using
the internet and ICTs in education seems to be a significant driver of citizens’ confidence
in their own skills. Several governments, notably Italy and France, have attempted to tackle
the skill issue later in life through a range of courses in computer skills.
As expected, there is a strong correlation between Internet use and PC penetration. Countries
such as Sweden have encouraged home use most actively through government initiatives, in
this case the ‘PC REFORM’ programme. This appears to exert more influence than reduction
in lower costs of access, since in leading countries such as Sweden and Australia, cost is
relatively high.
Understanding users’ access requirements
To fully understand online customer propensity to use online service we also need to consider
the user’s access location, access device and ‘webographics’, which can help target certain
types of customers and are an important constraint on site design. ‘Webographics’ is a term
coined by Grossnickle and Raskin (2001). According to these authors webographics includes:
Usage location (in most countries, many users access either from home or from work, with
home being the more popular choice)
Access device (browser and computer platform described in Chapter 3 including mobile
devices)
Connection speed – broadband versus dial-up connections
ISP
Experience level
Usage type
Usage level.
Competition in the marketplace amongst broadband providers has caused a great increase
in the broadband Internet access options available for consumers and small businesses. But
it should be borne in mind that these vary significantly by country as shown by Figure 4.2.
They show the web services should be tested for lower-speed Internet access.
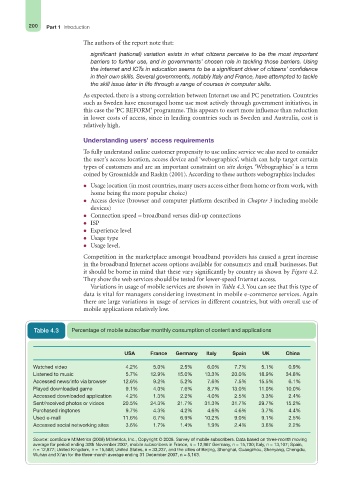
Variations in usage of mobile services are shown in Table 4.3. You can see that this type of
data is vital for managers considering investment in mobile e-commerce services. Again
there are large variations in usage of services in different countries, but with overall use of
mobile applications relatively low.
Table 4.3 Percentage of mobile subscriber monthly consumption of content and applications
USA France Germany Italy Spain UK China
Watched video 4.2% 5.0% 2.5% 6.0% 7.7% 5.1% 0.9%
Listened to music 5.7% 12.9% 15.0% 13.3% 20.0% 18.9% 34.8%
Accessed news/info via browser 12.6% 9.2% 5.2% 7.6% 7.5% 15.5% 6.1%
Played downloaded game 9.1% 4.0% 7.6% 8.7% 13.0% 11.0% 10.0%
Accessed downloaded application 4.2% 1.3% 2.2% 4.0% 2.5% 3.3% 2.4%
Sent/received photos or videos 20.5% 24.3% 21.7% 31.3% 31.7% 29.7% 15.2%
Purchased ringtones 9.7% 4.3% 4.2% 4.6% 4.6% 3.7% 4.4%
Used e-mail 11.6% 6.7% 6.9% 10.2% 9.0% 9.1% 2.5%
Accessed social networking sites 3.6% 1.7% 1.4% 1.9% 2.4% 3.6% 2.2%
Source: comScore M:Metrics (2008) M:Metrics, Inc., Copyright © 2008. Survey of mobile subscribers. Data based on three-month moving
average for period ending 30th November 2007, mobile subscribers in France, n = 12,867 Germany, n = 15,700; Italy, n = 13,107; Spain,
n = 12,877; United Kingdom, n = 15,588; United States, n = 33,237, and the cities of Beijing, Shanghai, Guangzhou, Shenyang, Chengdu,
Wuhan and Xi’an for the three-month average ending 31 December 2007, n = 5,163.