
Page 239 - E-Bussiness and E-Commerce Management Strategy, Implementation, and Practice
P. 239
M04_CHAF9601_04_SE_C04.QXD:D01_CHAF7409_04_SE_C01.QXD 16/4/09 11:11 Page 206
206 Part 1 Introduction
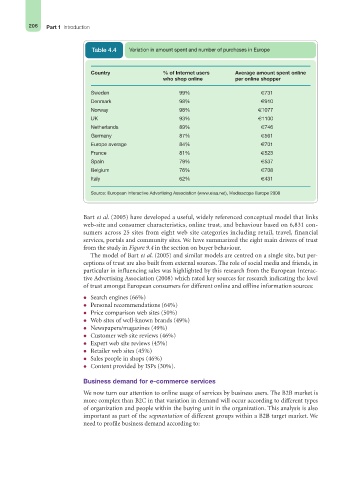
Table 4.4 Variation in amount spent and number of purchases in Europe
Country % of Internet users Average amount spent online
who shop online per online shopper
Sweden 99% €731
Denmark 98% €910
Norway 98% €1077
UK 93% €1100
Netherlands 89% €746
Germany 87% €561
Europe average 84% €701
France 81% €523
Spain 79% €537
Belgium 76% €708
Italy 62% €431
Source: European Interactive Advertising Association (www.eiaa.net), Mediascope Europe 2008
Bart et al. (2005) have developed a useful, widely referenced conceptual model that links
web-site and consumer characteristics, online trust, and behaviour based on 6,831 con-
sumers across 25 sites from eight web site categories including retail, travel, financial
services, portals and community sites. We have summarized the eight main drivers of trust
from the study in Figure 9.4 in the section on buyer behaviour.
The model of Bart et al. (2005) and similar models are centred on a single site, but per-
ceptions of trust are also built from external sources. The role of social media and friends, in
particular in influencing sales was highlighted by this research from the European Interac-
tive Advertising Association (2008) which rated key sources for research indicating the level
of trust amongst European consumers for different online and offline information sources:
Search engines (66%)
Personal recommendations (64%)
Price comparison web sites (50%)
Web sites of well-known brands (49%)
Newspapers/magazines (49%)
Customer web site reviews (46%)
Expert web site reviews (45%)
Retailer web sites (45%)
Sales people in shops (46%)
Content provided by ISPs (30%).
Business demand for e-commerce services
We now turn our attention to online usage of services by business users. The B2B market is
more complex than B2C in that variation in demand will occur according to different types
of organization and people within the buying unit in the organization. This analysis is also
important as part of the segmentation of different groups within a B2B target market. We
need to profile business demand according to: