
Page 360 - Effective group discussion theory and practice by Adams, Katherine H. Brilhart, John K. Galanes, Gloria J
P. 360
Tools for Assessing and Evaluating Groups 343
Group FIGURE 12.1
Verbal interaction
Time diagram
Begin
End
Place
Observer
Frequency and Direction
of Participation
Brown Jones
Marx Lingle
Gallo Radeau
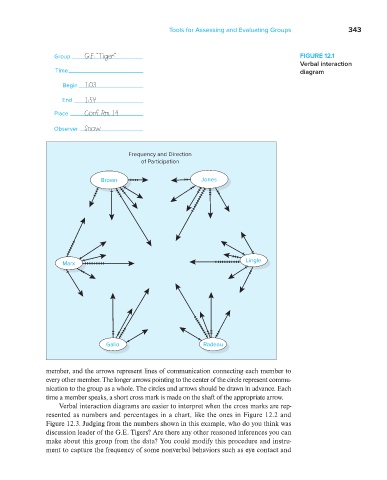
member, and the arrows represent lines of communication connecting each member to
every other member. The longer arrows pointing to the center of the circle represent commu-
nication to the group as a whole. The circles and arrows should be drawn in advance. Each
time a member speaks, a short cross mark is made on the shaft of the appropriate arrow.
Verbal interaction diagrams are easier to interpret when the cross marks are rep-
resented as numbers and percentages in a chart, like the ones in Figure 12.2 and
Figure 12.3. Judging from the numbers shown in this example, who do you think was
discussion leader of the G.E. Tigers? Are there any other reasoned inferences you can
make about this group from the data? You could modify this procedure and instru-
ment to capture the frequency of some nonverbal behaviors such as eye contact and
gal37018_ch12_321_352.indd 343 3/28/18 12:38 PM