
Page 115 - Earth's Climate Past and Future
P. 115
CHAPTER 5 • Greenhouse Climate 91
BOX 5-1 LOOKING DEEPER INTO CLIMATE SCIENCE
Calculating Changes in Sea Level
ater transferred between the continents and oceans elevation versus changes in distance) from region to
Wrepresents weight added to (or removed from) the region. Some areas have simple low-gradient profiles, but
bedrock underlying the ocean basins. When water is added gradients in other regions are steepened by mountain
to the ocean, the underlying bedrock sags under the load. building or other regional factors. As a result, changes in
Similarly, the bedrock rebounds if part of the water load is the total amount of water in the ocean or in the volume
removed. of water the ocean can hold need to be translated into
This bedrock response reduces the change in sea level actual net changes in the level of the global ocean
that would otherwise occur. For example, adding meltwater produced by the complications contained in all the locally
to the oceans raises sea level, but the depression of ocean varying profiles. All regional profiles are summed into a
bedrock under the load of the added water cancels about single hypsometric curve, a graph that displays the
30% of the sea level change. This 30% reduction is a direct proportions of Earth’s surface that lie at various altitudes
3
result of the difference in density between water (1 g/cm ) above and depths below sea level. Such a graph is easily
3
and bedrock (3.3 g/cm ): 1 3.3 = 0.3. constructed for today’s Earth, but the exercise becomes
The second complication is that the margins of more speculative for past intervals of plate tectonic
the oceans have widely varying profiles (changes in configurations.
a large weight added to (or removed from) the underly- 5-5 Effect of Changes in Sea Level on Climate
ing ocean crust, which sags (or rebounds) accordingly.
This response of the ocean crust decreases the net mag- Climate scientists have at times cited sea level as a poten-
nitude of the change in sea level. The other complication tial factor in long-term climate changes, although in vary-
has to do with translating a change in the volume of ing and often even contradictory ways. The most likely
ocean water or in the volume of the ocean basins into effect of sea level changes on climate is linked to the very
actual movement of sea level against the complex shapes different thermal responses of land and water (compan-
of the world’s continental margins. ion Web site, pp. 9–11). The shallow (10–200 m) layer of
Taken together, these factors can explain why sea ocean that overlaps the continental margins and invades
levels were some 120 to 220 m higher than the modern the interior seaways has the large heat capacity typical of
value 80 to 100 Myr ago (Table 5-1). Within a large water, in contrast to the small heat capacity typical of
range of uncertainty, these values match the estimated land. As a result, flooding of the land tends to moderate
amount of flooding of Cretaceous continents reason- continental extremes of climate and produce milder win-
ably well. The effect of seafloor spreading remains by ters and cooler summers. Withdrawal of the sea should
far the largest source of uncertainty. have the opposite effect. For large changes in global sea
level, the synchronous invasion and withdrawal of the
sea on many continents should result in simultaneous
fluctuations between harsh continental and mild mar-
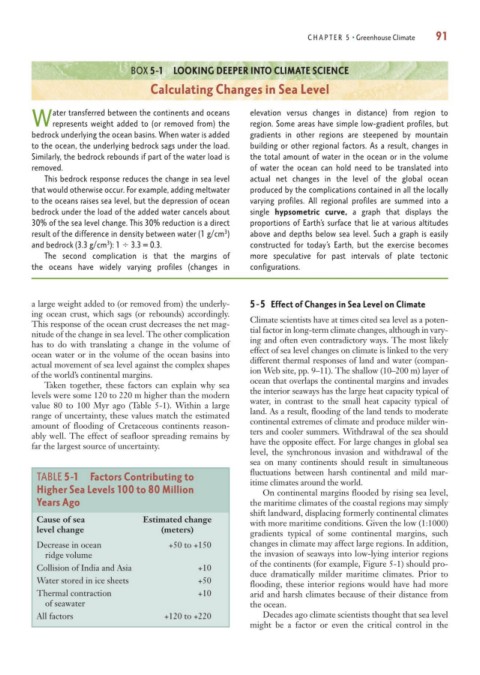
TABLE 5-1 Factors Contributing to
itime climates around the world.
Higher Sea Levels 100 to 80 Million On continental margins flooded by rising sea level,
Years Ago the maritime climates of the coastal regions may simply
shift landward, displacing formerly continental climates
Cause of sea Estimated change with more maritime conditions. Given the low (1:1000)
level change (meters)
gradients typical of some continental margins, such
Decrease in ocean +50 to +150 changes in climate may affect large regions. In addition,
ridge volume the invasion of seaways into low-lying interior regions
of the continents (for example, Figure 5-1) should pro-
Collision of India and Asia +10
duce dramatically milder maritime climates. Prior to
Water stored in ice sheets +50
flooding, these interior regions would have had more
Thermal contraction +10 arid and harsh climates because of their distance from
of seawater the ocean.
All factors +120 to +220 Decades ago climate scientists thought that sea level
might be a factor or even the critical control in the