
Page 110 - Earth's Climate Past and Future
P. 110
86 PART II • Tectonic-Scale Climate Change
further cooling the planet (companion Web site, p. 15).
With the planet covered by so much snow and ice, even Greenhouse
small changes in CO can have a relatively big impact in
2
altering the area of Earth covered by snow and ice, espe-
cially in winter. Small CO increases greatly reduce the
2
extent of this bright reflective area, while small decreases
in CO greatly enlarge it. This albedo-temperature feed-
2 15˚
back makes the climate system in an icehouse world react Global mean temperature (˚C) 20˚
strongly to changes in CO . Modern
2 (preindustrial)
In contrast, much higher CO values can reduce the
2
average amount of snow and ice present at high lati-
tudes. At CO levels near 1000 ppm, little or no sea ice
2 10˚
is present in the Arctic in summer, and only the central
Arctic has ice in winter. As a result, very small surface Extreme
areas of snow and ice are available to provide positive icehouse
feedback to changes in CO . Increases in CO produce 0 200 400 600 800 1000
2 2
warming, but little snow or ice is available to melt. As a CO level (ppm)
2
result, the climate system in a greenhouse world is
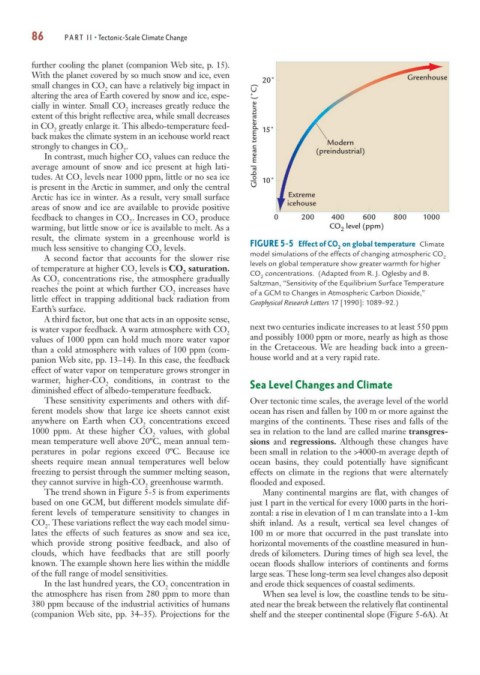
much less sensitive to changing CO levels. FIGURE 5-5 Effect of CO on global temperature Climate
2
2 model simulations of the effects of changing atmospheric CO
A second factor that accounts for the slower rise 2
of temperature at higher CO levels is CO saturation. levels on global temperature show greater warmth for higher
2 2 CO concentrations. (Adapted from R. J. Oglesby and B.
As CO concentrations rise, the atmosphere gradually 2
2 Saltzman, “Sensitivity of the Equilibrium Surface Temperature
reaches the point at which further CO increases have
2 of a GCM to Changes in Atmospheric Carbon Dioxide,”
little effect in trapping additional back radiation from Geophysical Research Letters 17 [1990]: 1089–92.)
Earth’s surface.
A third factor, but one that acts in an opposite sense,
is water vapor feedback. A warm atmosphere with CO next two centuries indicate increases to at least 550 ppm
2
values of 1000 ppm can hold much more water vapor and possibly 1000 ppm or more, nearly as high as those
than a cold atmosphere with values of 100 ppm (com- in the Cretaceous. We are heading back into a green-
panion Web site, pp. 13–14). In this case, the feedback house world and at a very rapid rate.
effect of water vapor on temperature grows stronger in
warmer, higher-CO conditions, in contrast to the
2 Sea Level Changes and Climate
diminished effect of albedo-temperature feedback.
These sensitivity experiments and others with dif- Over tectonic time scales, the average level of the world
ferent models show that large ice sheets cannot exist ocean has risen and fallen by 100 m or more against the
anywhere on Earth when CO concentrations exceed margins of the continents. These rises and falls of the
2
1000 ppm. At these higher CO values, with global sea in relation to the land are called marine transgres-
2
mean temperature well above 20ºC, mean annual tem- sions and regressions. Although these changes have
peratures in polar regions exceed 0ºC. Because ice been small in relation to the >4000-m average depth of
sheets require mean annual temperatures well below ocean basins, they could potentially have significant
freezing to persist through the summer melting season, effects on climate in the regions that were alternately
they cannot survive in high-CO greenhouse warmth. flooded and exposed.
2
The trend shown in Figure 5-5 is from experiments Many continental margins are flat, with changes of
based on one GCM, but different models simulate dif- just 1 part in the vertical for every 1000 parts in the hori-
ferent levels of temperature sensitivity to changes in zontal: a rise in elevation of 1 m can translate into a 1-km
CO . These variations reflect the way each model simu- shift inland. As a result, vertical sea level changes of
2
lates the effects of such features as snow and sea ice, 100 m or more that occurred in the past translate into
which provide strong positive feedback, and also of horizontal movements of the coastline measured in hun-
clouds, which have feedbacks that are still poorly dreds of kilometers. During times of high sea level, the
known. The example shown here lies within the middle ocean floods shallow interiors of continents and forms
of the full range of model sensitivities. large seas. These long-term sea level changes also deposit
In the last hundred years, the CO concentration in and erode thick sequences of coastal sediments.
2
the atmosphere has risen from 280 ppm to more than When sea level is low, the coastline tends to be situ-
380 ppm because of the industrial activities of humans ated near the break between the relatively flat continental
(companion Web site, pp. 34–35). Projections for the shelf and the steeper continental slope (Figure 5-6A). At