
Page 107 - Earth's Climate Past and Future
P. 107
CHAPTER 5 • Greenhouse Climate 83
A B
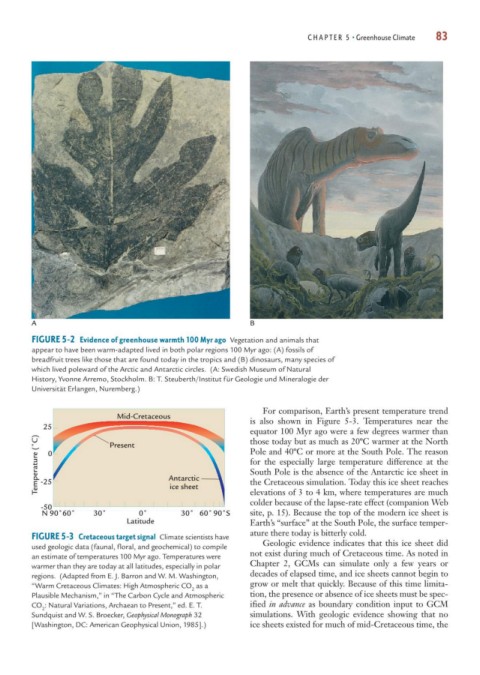
FIGURE 5-2 Evidence of greenhouse warmth 100 Myr ago Vegetation and animals that
appear to have been warm-adapted lived in both polar regions 100 Myr ago: (A) fossils of
breadfruit trees like those that are found today in the tropics and (B) dinosaurs, many species of
which lived poleward of the Arctic and Antarctic circles. (A: Swedish Museum of Natural
History, Yvonne Arremo, Stockholm. B: T. Steuberth/Institut für Geologie und Mineralogie der
Universität Erlangen, Nuremberg.)
For comparison, Earth’s present temperature trend
Mid-Cretaceous
is also shown in Figure 5-3. Temperatures near the
25
equator 100 Myr ago were a few degrees warmer than
Temperature (˚C) -25 Antarctic Pole and 40ºC or more at the South Pole. The reason
those today but as much as 20ºC warmer at the North
Present
0
for the especially large temperature difference at the
South Pole is the absence of the Antarctic ice sheet in
the Cretaceous simulation. Today this ice sheet reaches
ice sheet
elevations of 3 to 4 km, where temperatures are much
colder because of the lapse-rate effect (companion Web
-50
N 90˚ 60˚ 30˚ 0˚ 30˚ 60˚ 90˚S site, p. 15). Because the top of the modern ice sheet is
Latitude Earth’s “surface” at the South Pole, the surface temper-
ature there today is bitterly cold.
FIGURE 5-3 Cretaceous target signal Climate scientists have
used geologic data (faunal, floral, and geochemical) to compile Geologic evidence indicates that this ice sheet did
not exist during much of Cretaceous time. As noted in
an estimate of temperatures 100 Myr ago. Temperatures were
warmer than they are today at all latitudes, especially in polar Chapter 2, GCMs can simulate only a few years or
regions. (Adapted from E. J. Barron and W. M. Washington, decades of elapsed time, and ice sheets cannot begin to
“Warm Cretaceous Climates: High Atmospheric CO as a grow or melt that quickly. Because of this time limita-
2
Plausible Mechanism,” in “The Carbon Cycle and Atmospheric tion, the presence or absence of ice sheets must be spec-
CO : Natural Variations, Archaean to Present,” ed. E. T. ified in advance as boundary condition input to GCM
2
Sundquist and W. S. Broecker, Geophysical Monograph 32 simulations. With geologic evidence showing that no
[Washington, DC: American Geophysical Union, 1985].) ice sheets existed for much of mid-Cretaceous time, the