
Page 108 - Earth's Climate Past and Future
P. 108
84 PART II • Tectonic-Scale Climate Change
boundary condition specified for these simulations had temperatures poleward of 40º latitude were considerably
no ice sheets. With the Antarctic ice sheet absent, colder than the geologic estimates (see Figure 5-4).
Earth’s surface at the South Pole is closer to sea level The second simulation retained the changes in geog-
and the simulated polar temperatures are cold but much raphy but added another factor: CO levels four times
2
less frigid. higher the preindustrial average. A range of indirect
As part of this series of experiments, Barron and evidence suggests—with considerable uncertainty—that
colleagues defined a “target signal” (an independent atmospheric CO concentrations 100 Myr ago were
2
estimate of Cretaceous climate derived from observa- somewhere between four and ten times higher than
tions) to compare against the simulations. They com- those today. Barron and his colleagues chose a CO
2
piled estimates of surface temperatures 100 Myr ago value slightly more than four times the modern (prein-
from the available information—past distributions of dustrial) level. The higher CO level in this second sim-
2
temperature-sensitive vegetation, animals, and geochem- ulation further warmed the planet and removed much of
ical indicators—to use as climatic constraints on the the mismatch with the target signal at the poles and mid-
simulation. Each target-signal estimate of past tempera- latitudes, but this time the equatorial temperatures were
ture includes some amount of uncertainty. The red and hotter than the range suggested by geologic evidence.
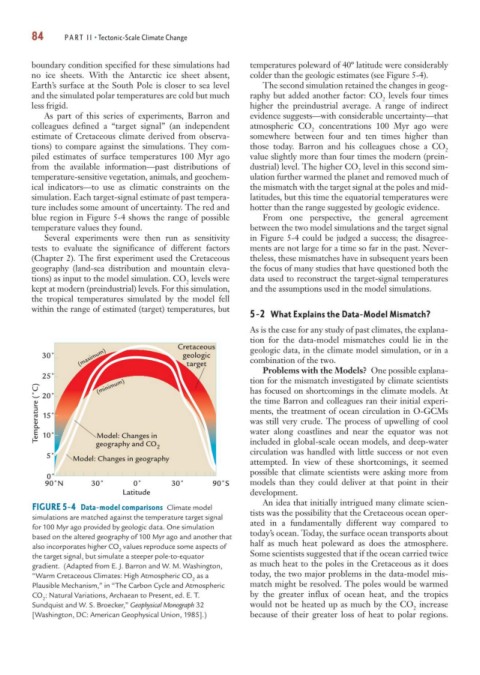
blue region in Figure 5-4 shows the range of possible From one perspective, the general agreement
temperature values they found. between the two model simulations and the target signal
Several experiments were then run as sensitivity in Figure 5-4 could be judged a success; the disagree-
tests to evaluate the significance of different factors ments are not large for a time so far in the past. Never-
(Chapter 2). The first experiment used the Cretaceous theless, these mismatches have in subsequent years been
geography (land-sea distribution and mountain eleva- the focus of many studies that have questioned both the
tions) as input to the model simulation. CO levels were data used to reconstruct the target-signal temperatures
2
kept at modern (preindustrial) levels. For this simulation, and the assumptions used in the model simulations.
the tropical temperatures simulated by the model fell
within the range of estimated (target) temperatures, but
5-2 What Explains the Data-Model Mismatch?
As is the case for any study of past climates, the explana-
tion for the data-model mismatches could lie in the
Cretaceous geologic data, in the climate model simulation, or in a
(maximum) target combination of the two.
30˚ geologic
Problems with the Models? One possible explana-
25˚ (minimum) tion for the mismatch investigated by climate scientists
Temperature (˚C) 20˚ the time Barron and colleagues ran their initial experi-
has focused on shortcomings in the climate models. At
ments, the treatment of ocean circulation in O-GCMs
15˚
was still very crude. The process of upwelling of cool
10˚
Model: Changes in
included in global-scale ocean models, and deep-water
geography and CO water along coastlines and near the equator was not
2
5˚ Model: Changes in geography circulation was handled with little success or not even
attempted. In view of these shortcomings, it seemed
possible that climate scientists were asking more from
0˚
90˚N 30˚ 0˚ 30˚ 90˚S models than they could deliver at that point in their
Latitude development.
An idea that initially intrigued many climate scien-
FIGURE 5-4 Data-model comparisons Climate model
simulations are matched against the temperature target signal tists was the possibility that the Cretaceous ocean oper-
for 100 Myr ago provided by geologic data. One simulation ated in a fundamentally different way compared to
based on the altered geography of 100 Myr ago and another that today’s ocean. Today, the surface ocean transports about
also incorporates higher CO values reproduce some aspects of half as much heat poleward as does the atmosphere.
2
the target signal, but simulate a steeper pole-to-equator Some scientists suggested that if the ocean carried twice
gradient. (Adapted from E. J. Barron and W. M. Washington, as much heat to the poles in the Cretaceous as it does
“Warm Cretaceous Climates: High Atmospheric CO as a today, the two major problems in the data-model mis-
2
Plausible Mechanism,” in “The Carbon Cycle and Atmospheric match might be resolved. The poles would be warmed
CO : Natural Variations, Archaean to Present, ed. E. T. by the greater influx of ocean heat, and the tropics
2
Sundquist and W. S. Broecker,” Geophysical Monograph 32 would not be heated up as much by the CO increase
2
[Washington, DC: American Geophysical Union, 1985].) because of their greater loss of heat to polar regions.