
Page 276 - Earth's Climate Past and Future
P. 276
252 PART IV • Deglacial Climate Changes
Millennial Oscillations During Glaciations Dust
18
δ 0 content
The first critical clue that the climate system is capable (‰) (mg/kg)
of large changes over short intervals came from studies –35 –30 2 1 0
of the deglacial Younger Dryas event, which lasted less Present
than 1500 years and began and ended very abruptly interglaciation
(Chapter 13). More recently, evidence has emerged that
an ongoing series of similar short-term oscillations is Younger
superimposed on orbital-scale climatic cycles. These 1800 Dryas
short-term fluctuations are largest and best defined
during glacial intervals.
14-1 Oscillations Recorded in Greenland Ice Cores
Long ice cores taken on Greenland in the 1970s recov- 1850
ered records spanning much of the last interglacial- Depth below ice surface (m)
glacial cycle (Figure 14–1). The upper portions of these
records were dated by counting annual layers, while the Last
age of the lower section was estimated by using theoret- glaciation
ical models of the flow of ice deeper in the ice sheets. 1900
Two signals from this ice record were particularly
18
important—the δ O composition of the ice and the
18
concentration of the dust in the ice. Signals of δ O in
ice cores record changes in the composition of the
water vapor that falls as snow and consolidates into ice
1950
(Appendix 1). Of the several processes that can affect
18
the δ O composition of ice (Table 14–1), local air tem-
perature is the primary control. Chemical analysis of
the dust has shown that the main source region was
Previous
northern Asia. The transport path may have followed
interglaciation
the northern branch of the split jet stream that moved 2000
across the Canadian margin of the North American ice
sheet (see Figure 12–11B).
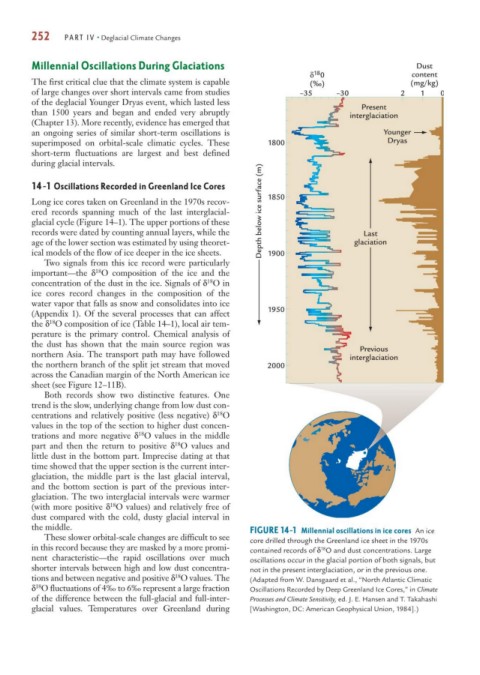
Both records show two distinctive features. One
trend is the slow, underlying change from low dust con-
18
centrations and relatively positive (less negative) δ O
values in the top of the section to higher dust concen-
18
trations and more negative δ O values in the middle
18
part and then the return to positive δ O values and
little dust in the bottom part. Imprecise dating at that
time showed that the upper section is the current inter-
glaciation, the middle part is the last glacial interval,
and the bottom section is part of the previous inter-
glaciation. The two interglacial intervals were warmer
18
(with more positive δ O values) and relatively free of
dust compared with the cold, dusty glacial interval in
the middle.
FIGURE 14-1 Millennial oscillations in ice cores An ice
These slower orbital-scale changes are difficult to see
core drilled through the Greenland ice sheet in the 1970s
in this record because they are masked by a more promi- contained records of δ O and dust concentrations. Large
18
nent characteristic—the rapid oscillations over much oscillations occur in the glacial portion of both signals, but
shorter intervals between high and low dust concentra- not in the present interglaciation, or in the previous one.
18
tions and between negative and positive δ O values. The (Adapted from W. Dansgaard et al., “North Atlantic Climatic
18
δ O fluctuations of 4‰ to 6‰ represent a large fraction Oscillations Recorded by Deep Greenland Ice Cores,” in Climate
of the difference between the full-glacial and full-inter- Processes and Climate Sensitivity, ed. J. E. Hansen and T. Takahashi
glacial values. Temperatures over Greenland during [Washington, DC: American Geophysical Union, 1984].)