
Page 118 - Electric Drives and Electromechanical Systems
P. 118
Chapter 4 Velocity and position transducers 111
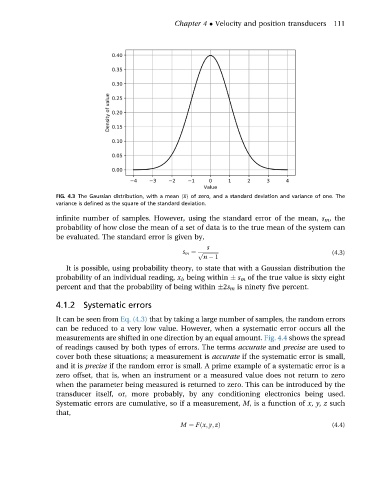
FIG. 4.3 The Gaussian distribution, with a mean ðxÞ of zero, and a standard deviation and variance of one. The
variance is defined as the square of the standard deviation.
infinite number of samples. However, using the standard error of the mean, s m , the
probability of how close the mean of a set of data is to the true mean of the system can
be evaluated. The standard error is given by,
s
s m ¼ p ffiffiffiffiffiffiffiffiffiffiffiffi (4.3)
n 1
It is possible, using probability theory, to state that with a Gaussian distribution the
probability of an individual reading, x i , being within s m of the true value is sixty eight
percent and that the probability of being within 2s m is ninety five percent.
4.1.2 Systematic errors
It can be seen from Eq. (4.3) that by taking a large number of samples, the random errors
can be reduced to a very low value. However, when a systematic error occurs all the
measurements are shifted in one direction by an equal amount. Fig. 4.4 shows the spread
of readings caused by both types of errors. The terms accurate and precise are used to
cover both these situations; a measurement is accurate if the systematic error is small,
and it is precise if the random error is small. A prime example of a systematic error is a
zero offset, that is, when an instrument or a measured value does not return to zero
when the parameter being measured is returned to zero. This can be introduced by the
transducer itself, or, more probably, by any conditioning electronics being used.
Systematic errors are cumulative, so if a measurement, M, is a function of x, y, z such
that,
M ¼ Fðx; y; zÞ (4.4)