
Page 120 - Electric Drives and Electromechanical Systems
P. 120
Chapter 4 Velocity and position transducers 113
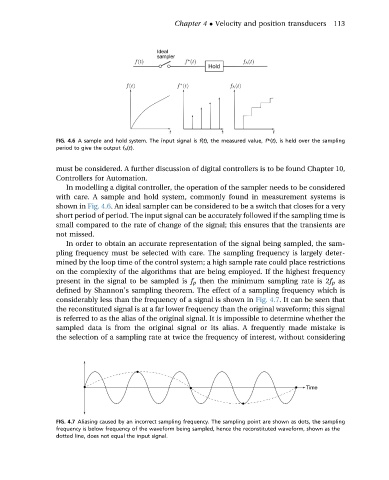
FIG. 4.6 A sample and hold system. The input signal is f(t), the measured value, f*(t), is held over the sampling
period to give the output f h (t).
must be considered. A further discussion of digital controllers is to be found Chapter 10,
Controllers for Automation.
In modelling a digital controller, the operation of the sampler needs to be considered
with care. A sample and hold system, commonly found in measurement systems is
shown in Fig. 4.6. An ideal sampler can be considered to be a switch that closes for a very
short period of period. The input signal can be accurately followed if the sampling time is
small compared to the rate of change of the signal; this ensures that the transients are
not missed.
In order to obtain an accurate representation of the signal being sampled, the sam-
pling frequency must be selected with care. The sampling frequency is largely deter-
mined by the loop time of the control system; a high sample rate could place restrictions
on the complexity of the algorithms that are being employed. If the highest frequency
present in the signal to be sampled is f p then the minimum sampling rate is 2f p as
defined by Shannon’s sampling theorem. The effect of a sampling frequency which is
considerably less than the frequency of a signal is shown in Fig. 4.7. It can be seen that
the reconstituted signal is at a far lower frequency than the original waveform; this signal
is referred to as the alias of the original signal. It is impossible to determine whether the
sampled data is from the original signal or its alias. A frequently made mistake is
the selection of a sampling rate at twice the frequency of interest, without considering
FIG. 4.7 Aliasing caused by an incorrect sampling frequency. The sampling point are shown as dots, the sampling
frequency is below frequency of the waveform being sampled, hence the reconstituted waveform, shown as the
dotted line, does not equal the input signal.