
Page 89 - Electronic Commerce
P. 89
Chapter 2
commercial use of the Internet as a service that would primarily benefit the Internet’s
noncommercial users. As the 1990s began, people from all walks of life—not just scientists
64 or academic researchers—started thinking of these networks as the global resource that
we now know as the Internet. Although this network of networks had grown from four
Defense Department computers in 1969 to more than 300,000 computers on many
interconnected networks by 1990, the greatest growth of the Internet was yet to come.
Growth of the Internet
In 1991, the NSF further eased its restrictions on commercial Internet activity and began
implementing plans to privatize the Internet. The privatization of the Internet was
substantially completed in 1995, when the NSF turned over the operation of the main
Internet connections to a group of privately owned companies. The new structure of the
Internet was based on four network access points (NAPs) located in San Francisco, New
York, Chicago, and Washington, DC, each operated by a separate telecommunications
company. As the Internet grew, more companies opened more NAPs in more locations.
These companies, known as network access providers, sell Internet access rights directly
to larger customers and indirectly to smaller firms and individuals through other
companies, called Internet service providers (ISPs).
The Internet was a phenomenon that had truly sneaked up on an unsuspecting world.
The researchers who had been so involved in the creation and growth of the Internet just
accepted it as part of their working environment. However, people outside the research
community were largely unaware of the potential offered by a large interconnected set of
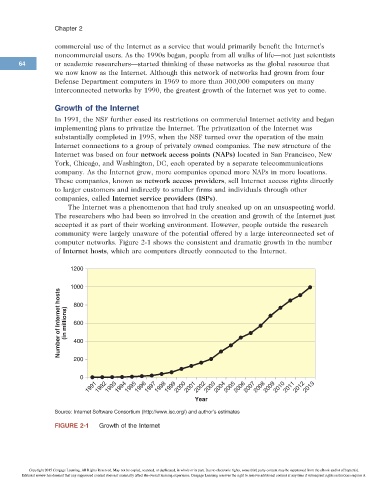
computer networks. Figure 2-1 shows the consistent and dramatic growth in the number
of Internet hosts, which are computers directly connected to the Internet.
1200
1000
Number of Internet hosts (in millions) 600
800
400
200
0
1991 1992 1993 1994 1995 1996 1997 1998 1999 2000 2001 2002 2003 2004 2005 2006 2007 2008 2009 2010 2011 2012 2013
Year
Source: Internet Software Consortium (http://www.isc.org/) and author’s estimates
FIGURE 2-1 Growth of the Internet
Copyright 2015 Cengage Learning. All Rights Reserved. May not be copied, scanned, or duplicated, in whole or in part. Due to electronic rights, some third party content may be suppressed from the eBook and/or eChapter(s).
Editorial review has deemed that any suppressed content does not materially affect the overall learning experience. Cengage Learning reserves the right to remove additional content at any time if subsequent rights restrictions require it.