
Page 92 -
P. 92
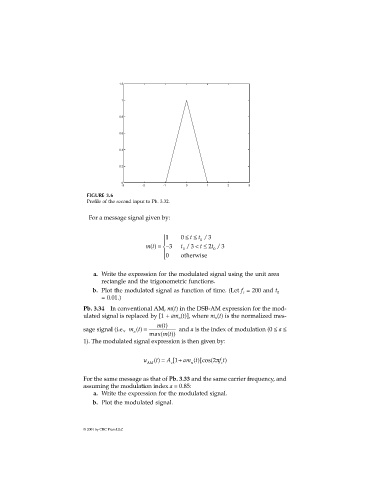
FIGURE 3.6
Profile of the second input to Pb. 3.32.
For a message signal given by:
1 0 ≤≤ t / 3
t
0
mt() = −3 t / < ≤3 t 2 t / 3
0
0
0 otherwise
a. Write the expression for the modulated signal using the unit area
rectangle and the trigonometric functions.
b. Plot the modulated signal as function of time. (Let f = 200 and t 0
c
= 0.01.)
Pb. 3.34 In conventional AM, m(t) in the DSB-AM expression for the mod-
ulated signal is replaced by [1 + am (t)], where m (t) is the normalized mes-
n
n
sage signal (i.e., mt() = mt() and a is the index of modulation (0 ≤ a ≤
n
max( mt( ))
1). The modulated signal expression is then given by:
u t ( ) = A [ +1 am t( )]cos(2π f t)
AM c n c
For the same message as that of Pb. 3.33 and the same carrier frequency, and
assuming the modulation index a = 0.85:
a. Write the expression for the modulated signal.
b. Plot the modulated signal.
© 2001 by CRC Press LLC